Let me start by saying comparing 2020 General Election Early Voting to 2024 General Election 2024 is comparing apples to oranges, and you can’t read much of anything into it on the surface other than “this is how many votes have been cast”. Why?
2020 was during a pandemic
3 weeks of early voting
A very different outlook on leveraging vote by mail, so timing of when votes come in is different
2024
2 weeks of early voting
Mail in ballots, who needs ‘em?
That said, wanna see some numbers?
I keep hearing people talking about “historic numbers” and I’m just not sure what they are talking about. ESPECIALLY if you are looking for a certain cerulean team to win.
Let me give you a little context on that ESPECIALLY. Right after the 2022 General Election, I waded through the results of every Presidential election since 2000, plotted all 254 counties vote outcomes and diversity of population, tracking the trends. What I found you can read fully in
Focus For The Future
and
What I found was the 254 counties in Texas fell into four groups or Tiers
Tier 1 - 11 Counties Blue in 2020 & going more Blue
Tier 2 - 12 Red in 2020 & going more Blue
Tier 3 - 10 Blue in 2020 & going more Red
And yeah, 221 counties I flagged as No Focus as they were Red in 2020 & going more Red
My point was with limited resources (time and money), if Team Cerulean wanted to actually put a win on the board (the first since 1994), they would have to get focus on 33 counties, tapping primarily into those who aren't voting, but likely are aligned with the beliefs of the party.
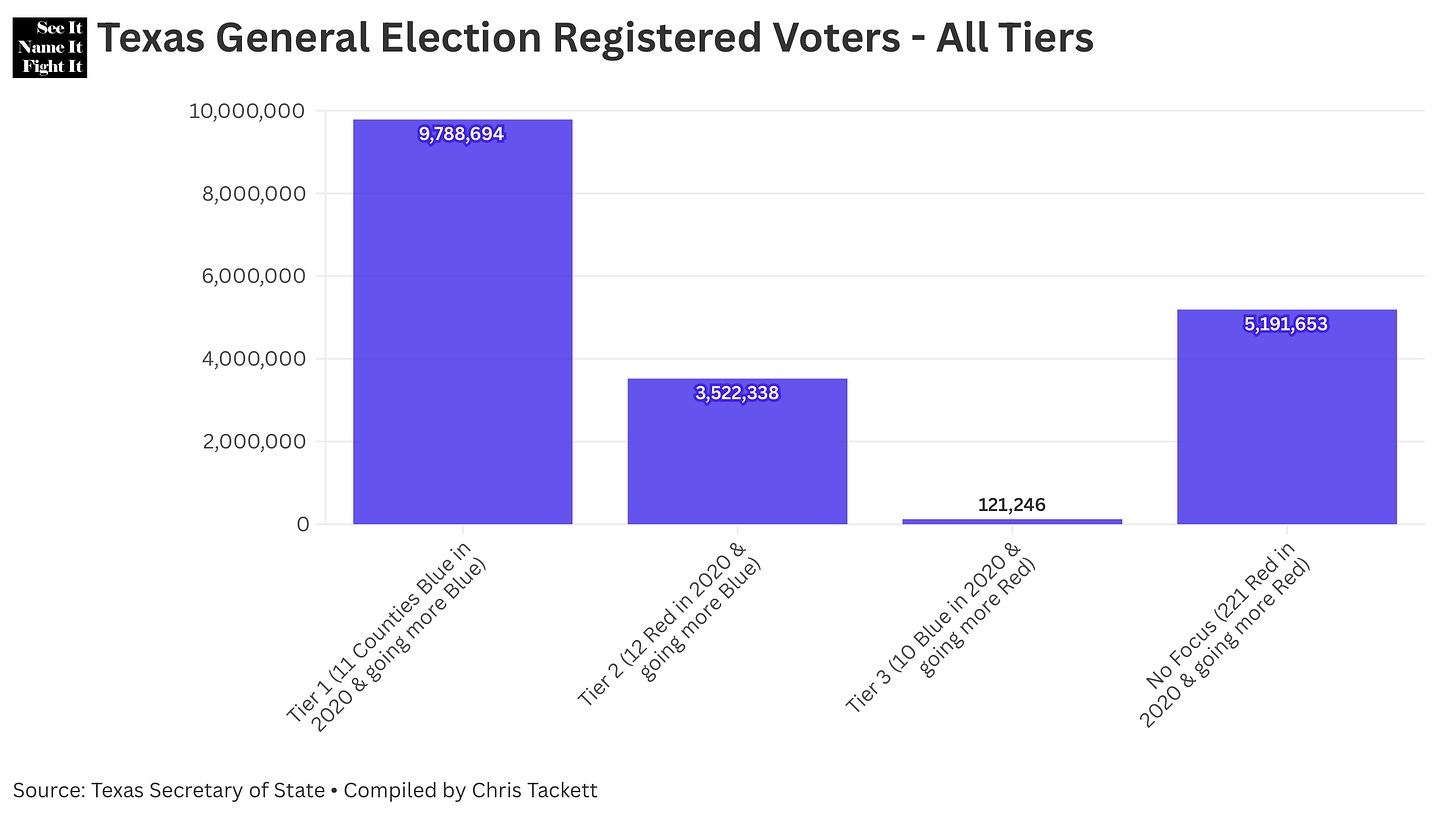
Let’s understand just how many registered voters are in each one of those Tiers.
Based on the numbers, if Team Cerulean intends to win statewide in 2024, one would think their best chance would be if they run up the numbers in Tier 1, where they are already winning, in some cases by significant margins, but there are soooooo many non-voters in those spaces. Then continue to move the needle in Tier 2, and just hold serve in Tier 3.
Conversely, the bigger the numbers in No Focus, the less likely a statewide win for Cerulean becomes, as many of those 221 mostly rural counties vote 75 to 80 or more % for Team Carmine.
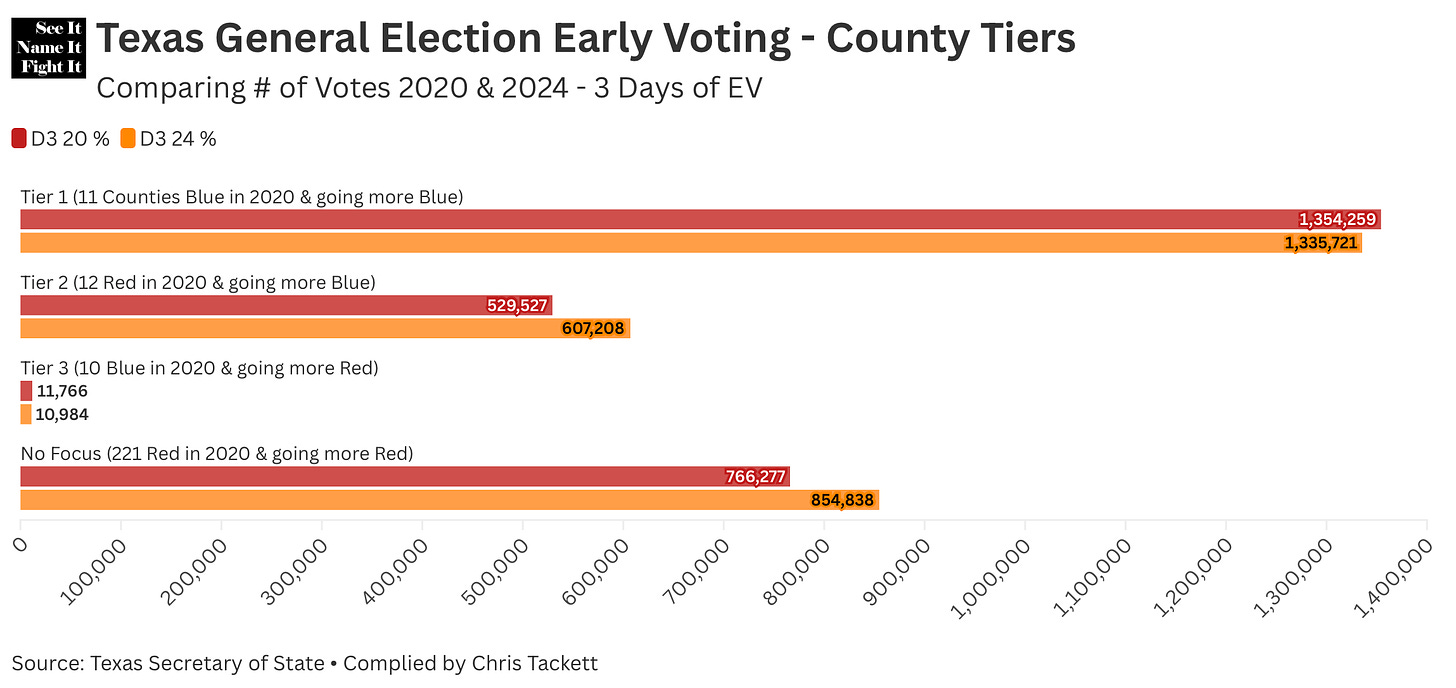
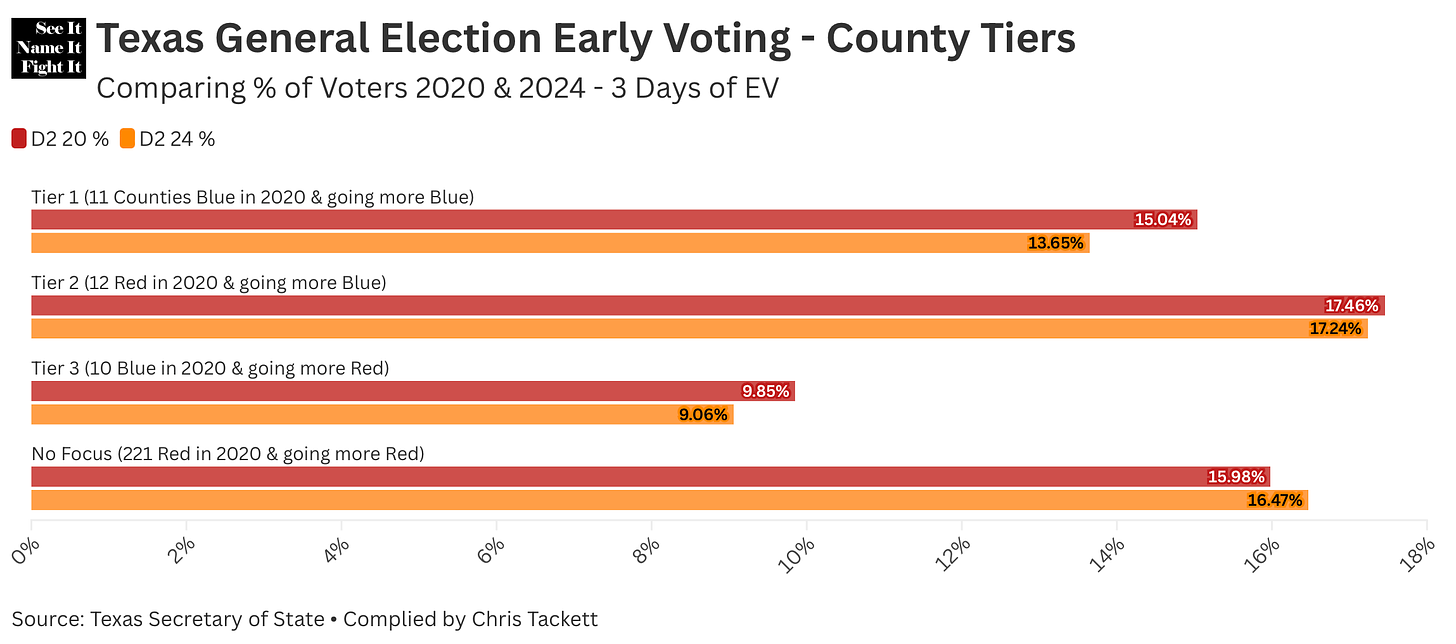
So where are we? Let’s tell the tale with charts!
All Tier comparison - Total Votes Cast
All Tier comparison - % of Registered Voters having Cast a Ballot
And just in case the bars are tough to read, here is what probably tells the story the best:
All Tier Comparison - The Change in Votes Cast in 2024 vs 2020
Tier 1 is down 18k votes compared to 2020
Tier 2 is up 77k
Tier 3 is down 782
Tier 4 is up 88k
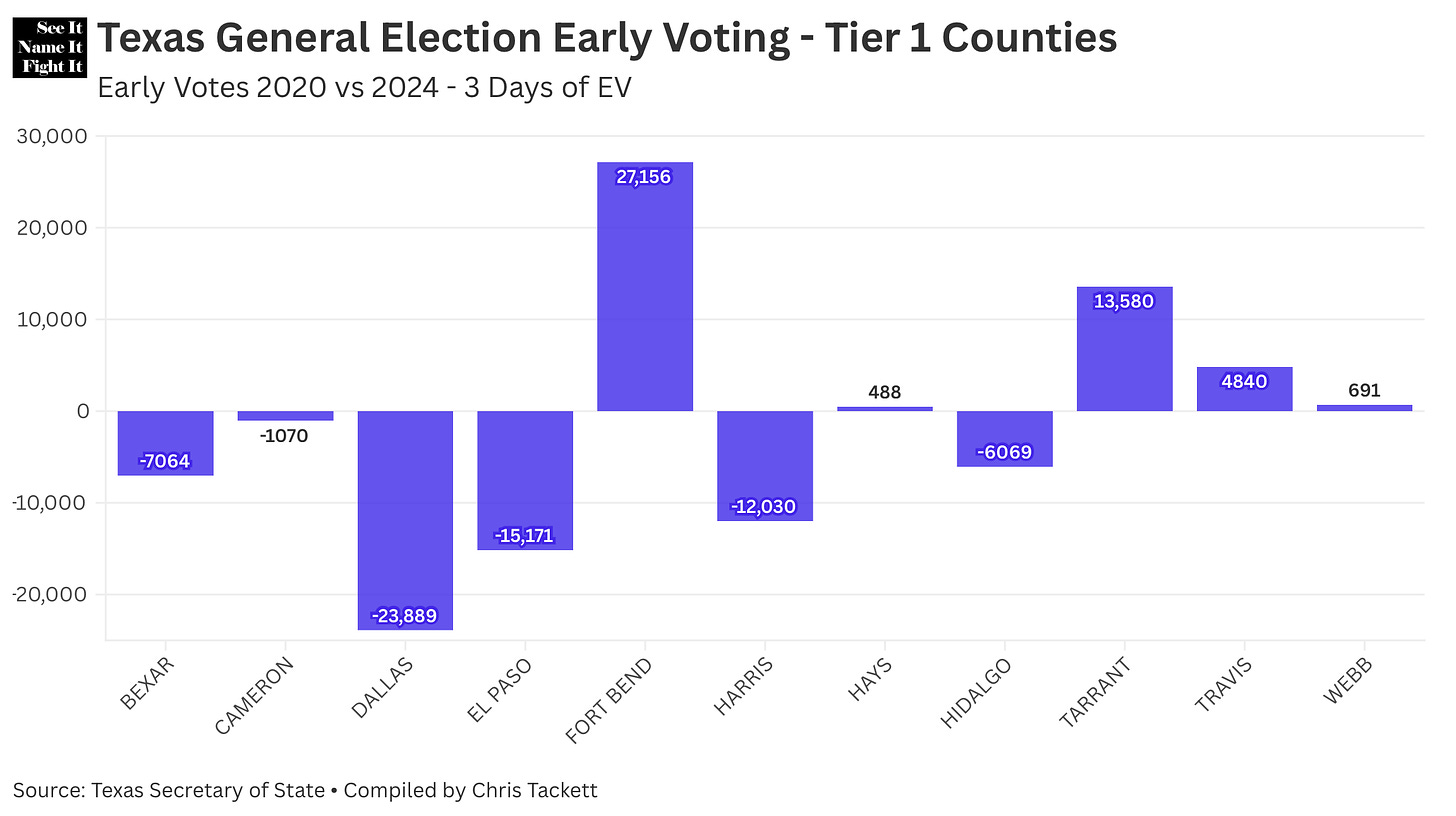
Just so you have more specifics (as people always want specifics, here are same charts with the counties in Tier 1.
Tier 1 comparison - Total Votes Cast
Tier 1 comparison - % of Registered Voters having Cast a Ballot
Tier 1 Comparison - The Change in Votes Cast in 2024 vs 2020
Team Cerulean, make sure you are getting your people out to vote if you want to win.
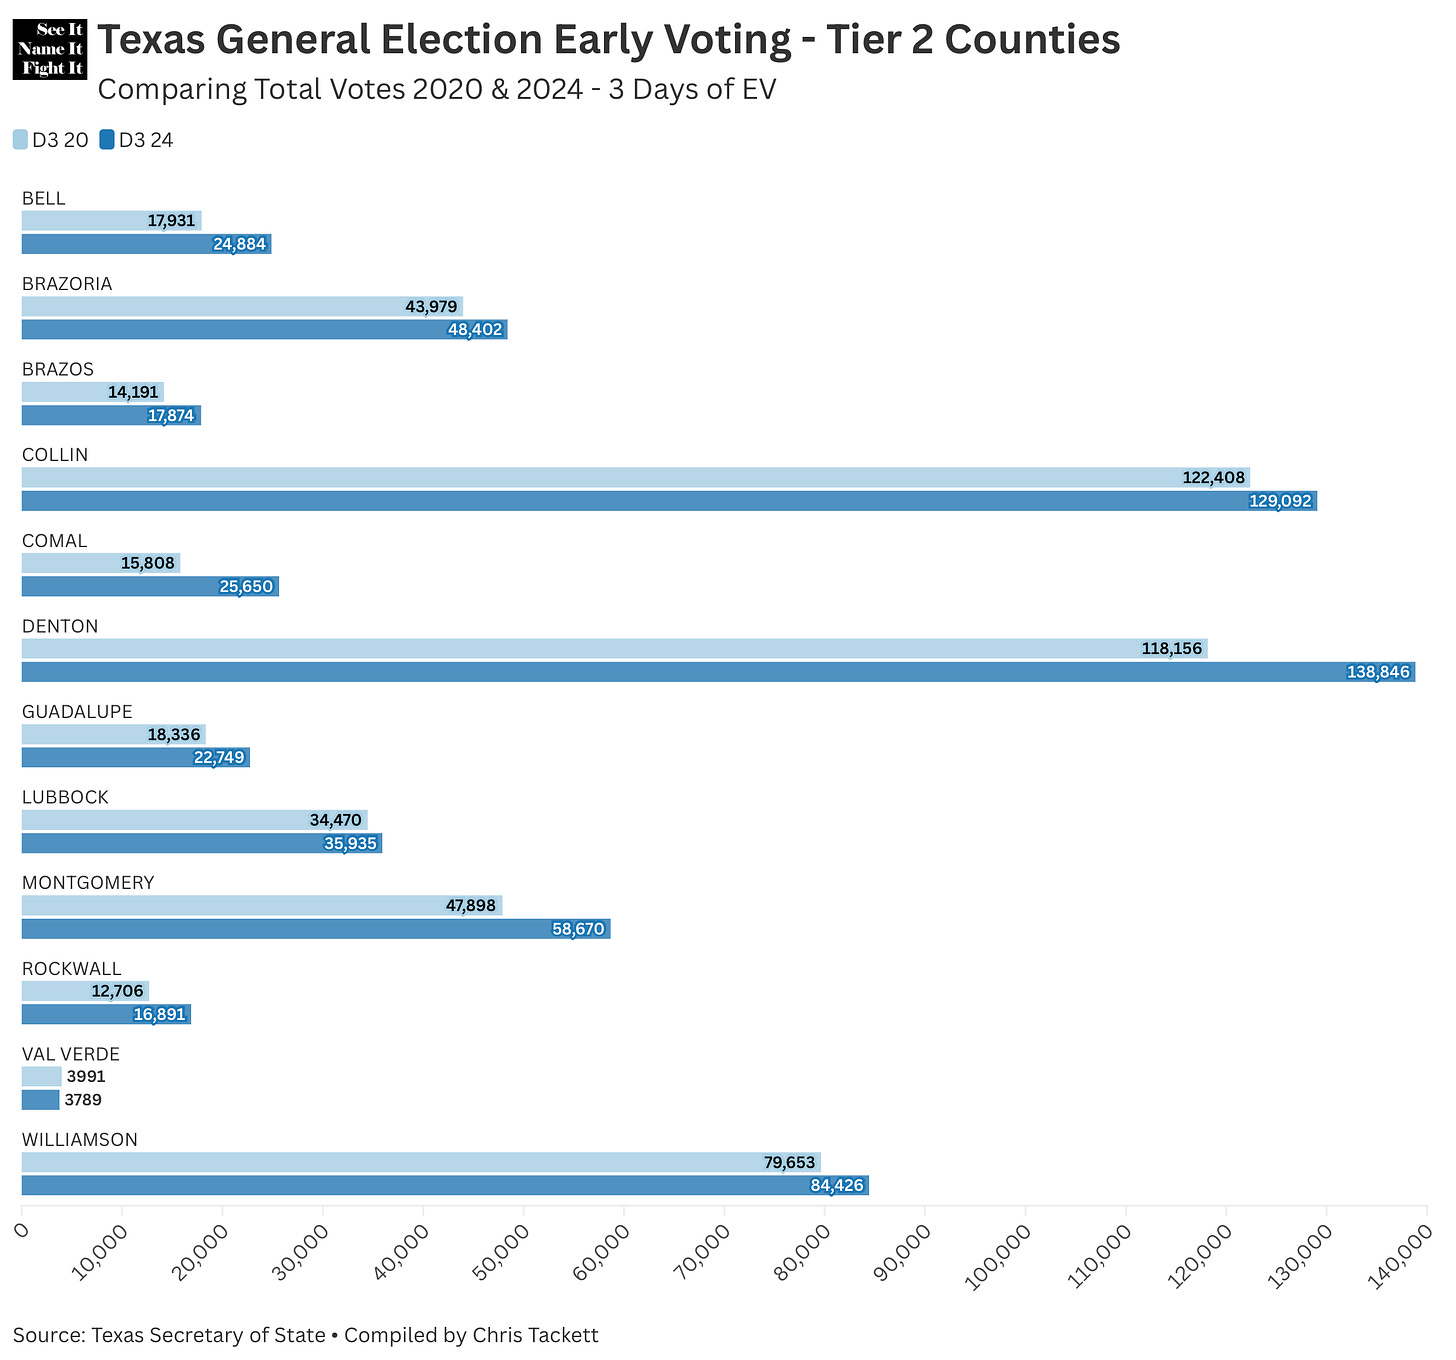
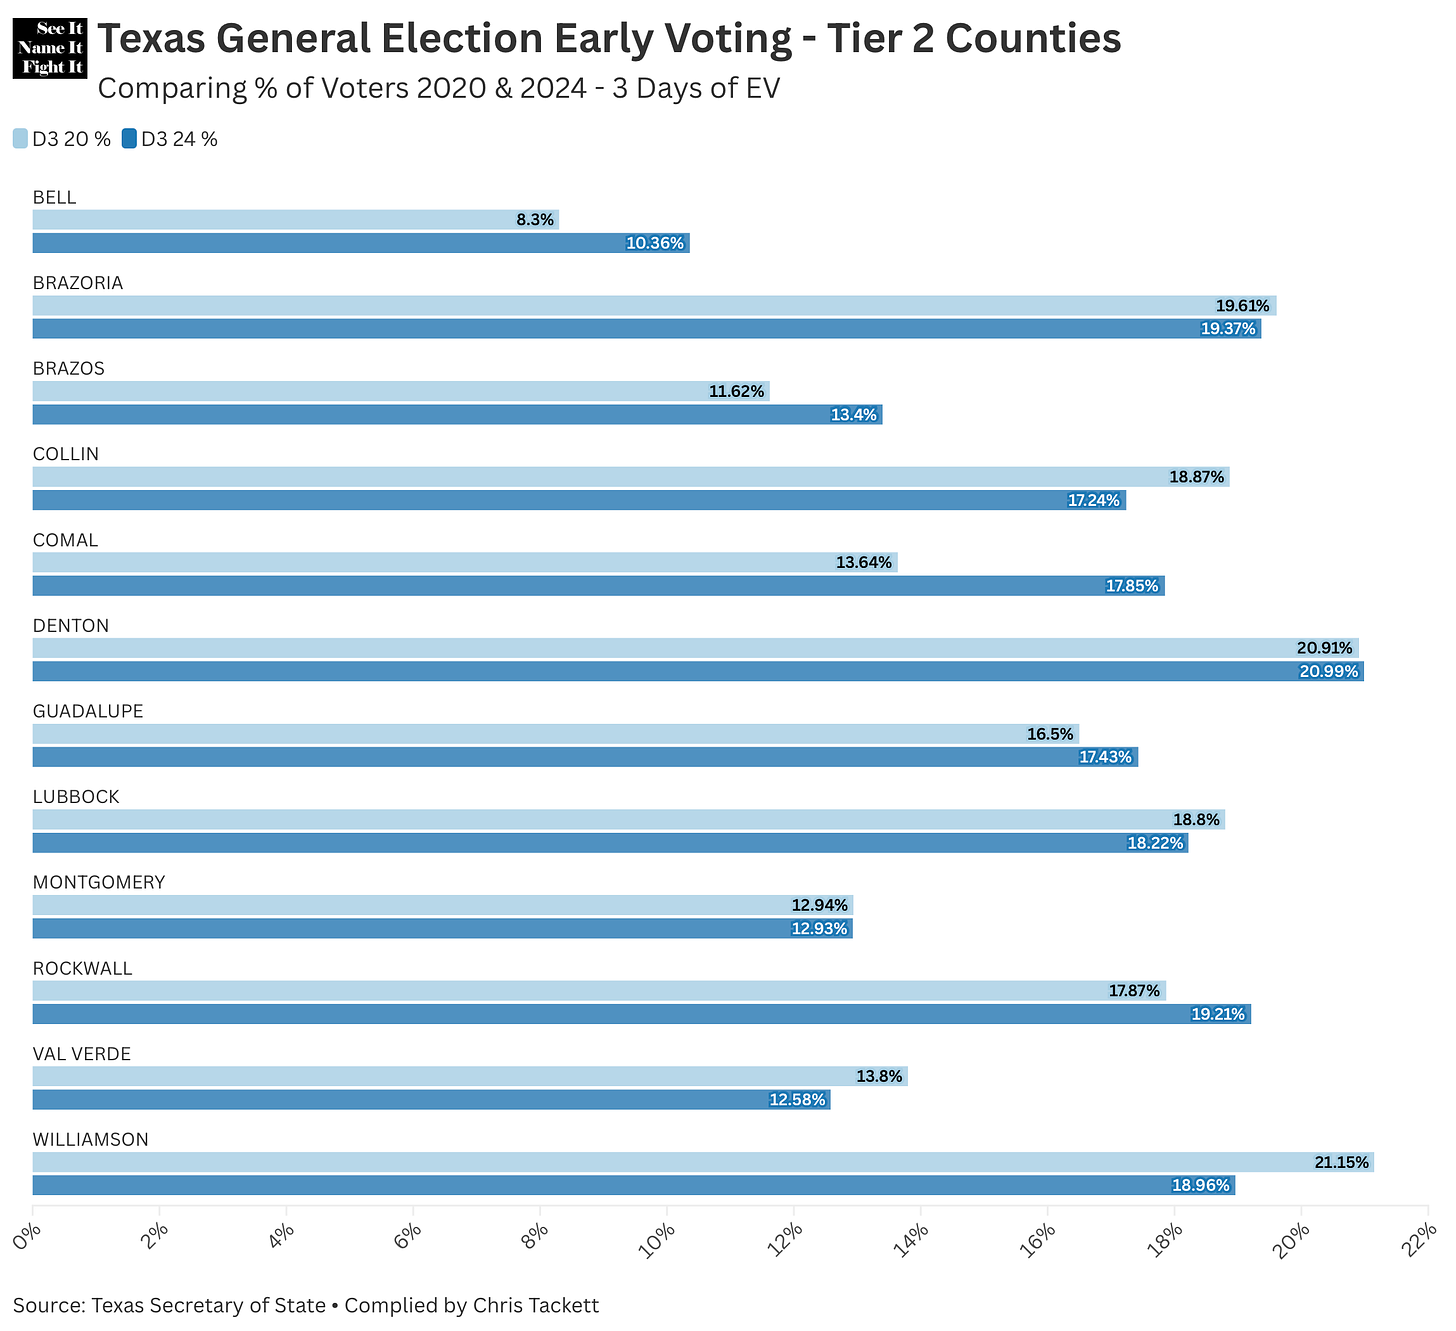
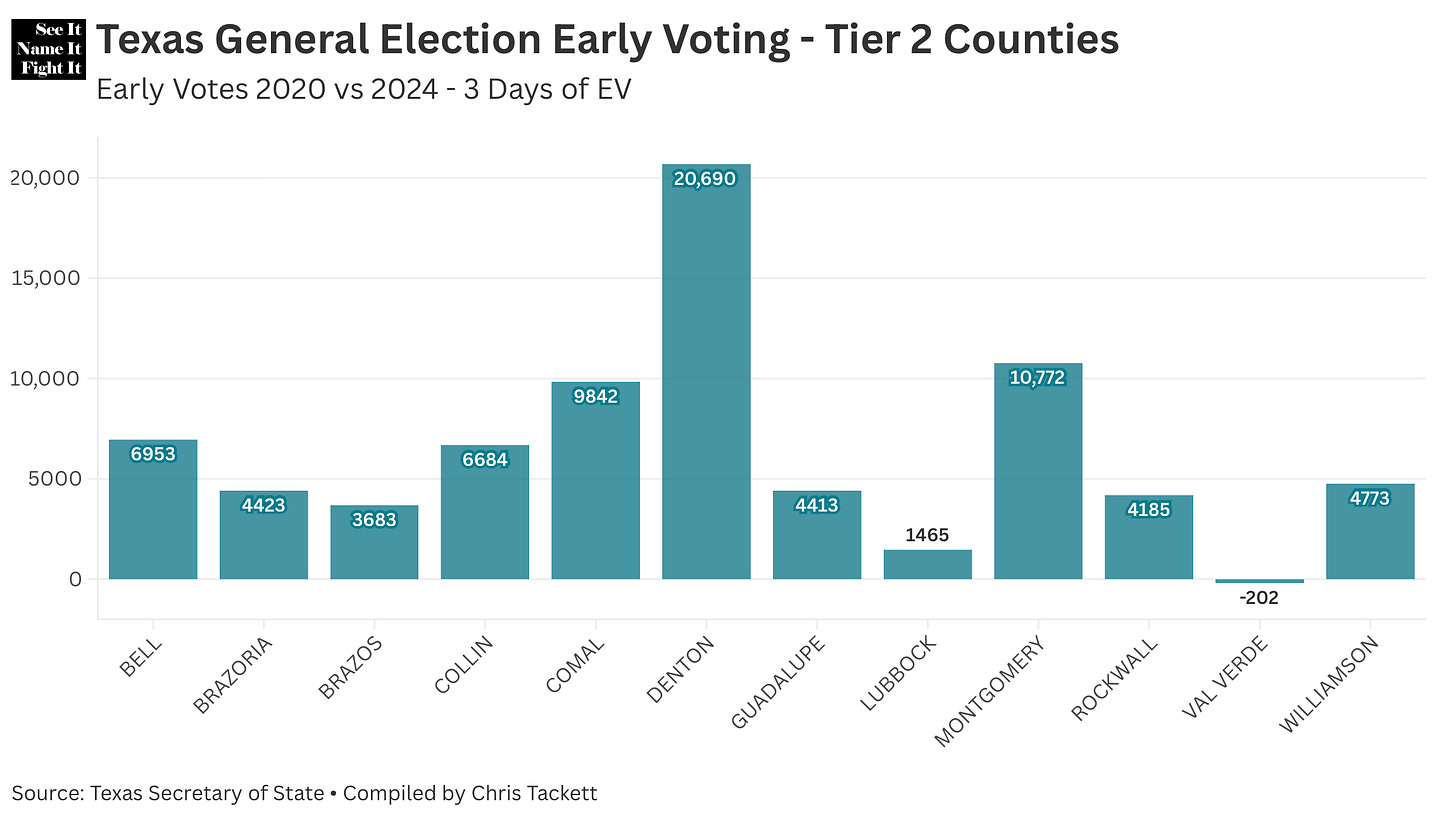
Let’s also run through the counties in Tier 2, with the same charts.
Tier 2 comparison - Total Votes Cast
Tier 2 comparison - % of Registered Voters having Cast a Ballot
Tier 2 Comparison - The Change in Votes Cast in 2024 vs 2020
All but one with more votes than 2020. Are those new Cerulean votes or panicked Carmines? We won’t know until the night of November 5th.
Ok, enough numbers tonight. I may revisit this at some point next week if folks want me to.
Some may look at what I captured above and say I’m a huge Debbie Downer. Well, I always try and be a realist. Where I think we need the most turnout, I’m not seeing it. I don’t want a single person to think this is in the bag and they don’t need to show up and vote. Everyone needs to know their vote matters, and that if they don’t cast a ballot, it could mean things don’t go the way we want them too. We still have time. Get to the polls. Get your friends and family to the polls. Let’s go!
See It. Name It. Fight It.




It what I had hoped for, but I do appreciate the information. Thank you.