In Part I of Focus For The Future (can we call it A New Hope?), I showed the connection of diversity and voting patterns across Texas, where growth is occurring, and where engaging potential voters could make a key difference in statewide outcomes.
Remember where the focus needs to be for Democrats.
When resources are limited, you have to choose where to invest. There are three tiers to focus on.
Tier 1
Where should the majority of investment and focus go in Texas? Fish where the fish are. There are eleven counties that are already blue and the voting outcome and population trend lines show getting both more blue and more diverse. They are also where there were 3,095,653 registered non-voters in 2020. These areas have all grown since 2020, so even more voters for 2024.
I’m going to show you the top 5 in available votes from this Tier, which are also the five largest counties in Texas, just to illustrate the dual declining trends.
Harris County - Ranked 1st in registered voters with 2,480,522
54.3% Republican in 2000
42.7% Republican in 2020 (11.6 decline)
839,632 Registered Non-Voters
Dallas County - Ranked 2nd in registered voters with 1,398,469
52.6% Republican in 2000
33.4% Republican in 2020 (19.2 decline)
478,981 Registered Non-Voters
Tarrant County - Ranked 3rd in registered voters with 1,212,524
60.7% Republican in 2000
49.1% Republican in 2020 (11.6 decline) Biden received 49.31%, so it lands on the “Blue” list
377,820 Registered Non-Voters
Bexar County - Ranked 4th in registered voters with 1,189,373
52.2% Republican in 2000
40.0% Republican in 2020 (12.2 decline)
418,532 Registered Non-Voters
Travis County - Ranked 5th in registered voters with 854,577
46.9% Republican in 2000
26.5% Republican in 2020 (20.4 decline)
246,045 Registered Non-Voters
Tier 2
The second area of focus should be in counties that while still red show consistent movement more blue. There are twelve red counties that are getting more diverse and getting consistently (albeit slowly) more blue. There are 839,447 votes available in 2020 in this tier.
As I did in Tier 1, let me show you the top 5 in available votes from Tier 2, which again illustrate the dual declining trends.
Collin County - Ranked 6th in registered voters with 648,670
73.1% Republican in 2000
51.4% Republican in 2020 (21.7 decline)
157,824 Registered Non-Voters
Denton County - Ranked 7th in registered voters with 565,089
69.6% Republican in 2000
53.2% Republican in 2020 (16.4 decline)
147,158 Registered Non-Voters
Montgomery County - Ranked 12th in registered voters with 370,060
75.9% Republican in 2000
71.2% Republican in 2020 (4.7 decline) This one is right on the margin. Yes, less red, but the hope here is the diversity of the county changing by almost 20 points. It’s worth targeted investment.
98,507 Registered Non-Voters
Bell County - Ranked 15th in registered voters with 215,974
65.1% Republican in 2000
53.3% Republican in 2020 (11.8 decline)
88,588 Registered Non-Voters
Williamson County - Ranked 11th in registered voters with 376,672
67.8% Republican in 2000
48.3% Republican in 2020 (19.5 decline)
88,588 Registered Non-Voters
Tier 3
The final area of focus should be in counties that have traditionally been blue, but are seeing some trends red that need investment to stabilize and shift back. There are ten counties in Tier 3, with 60,358 votes available in 2020. Tier 3 is about turnout in general.
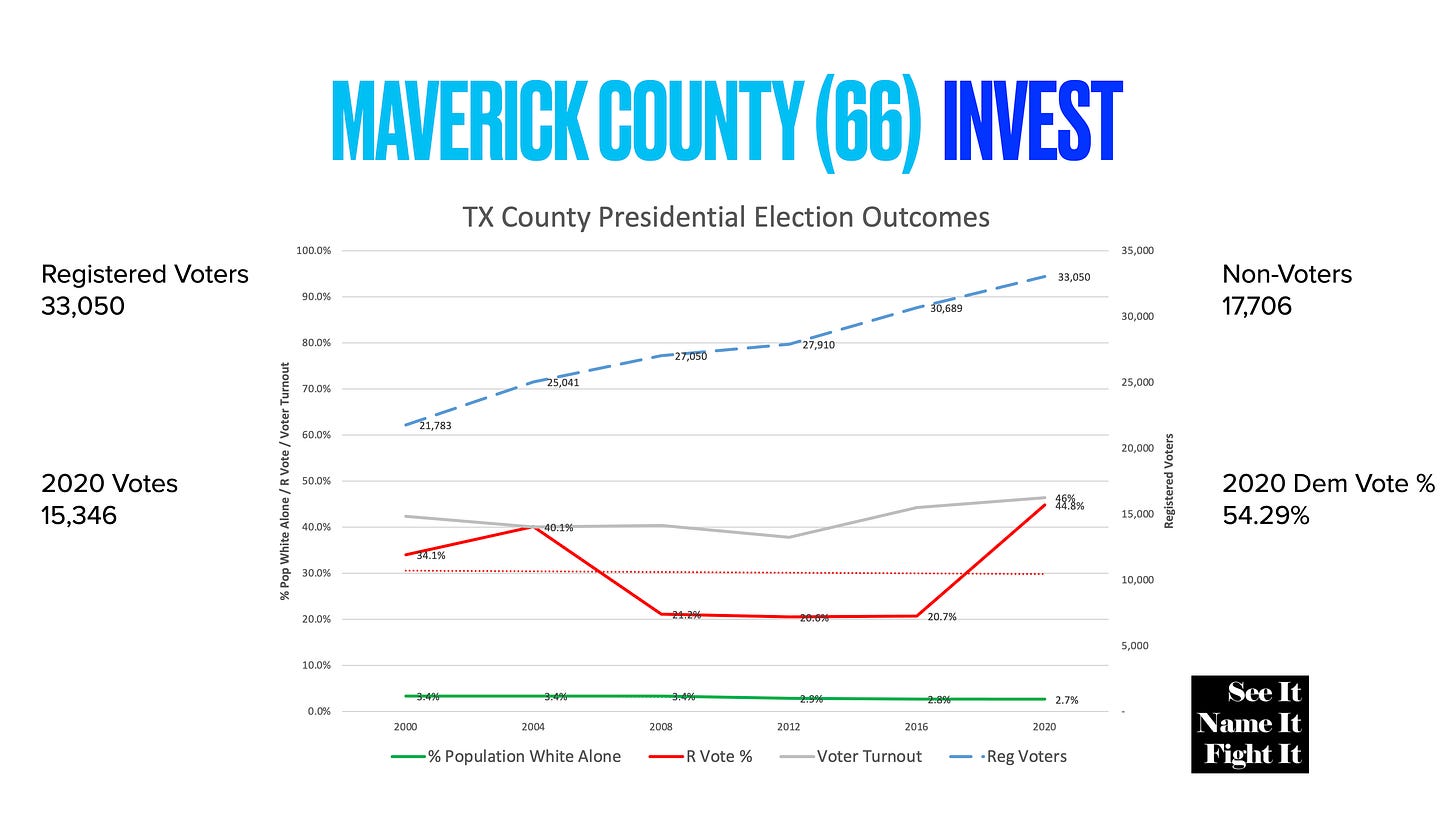
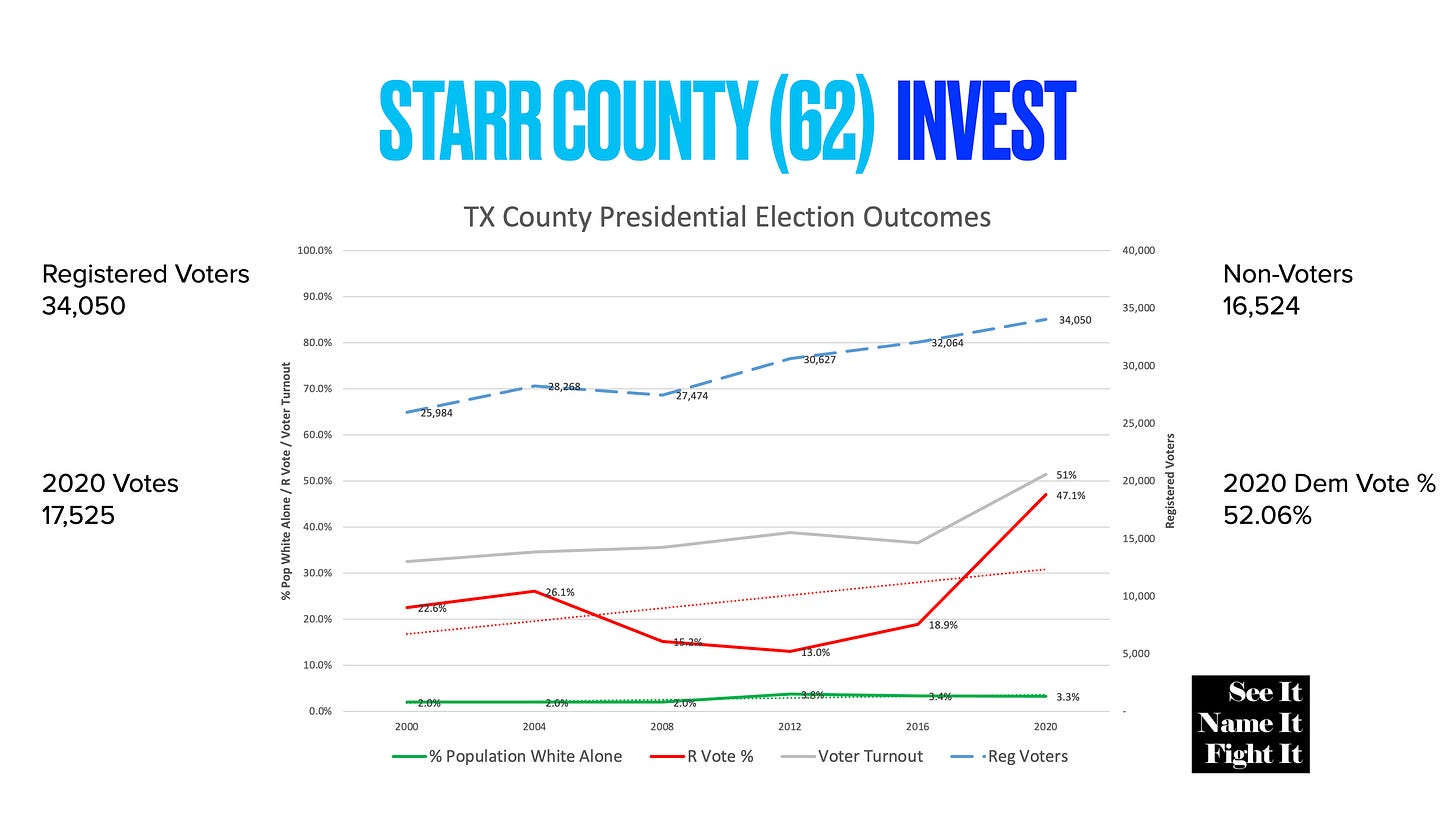
Here are the top 2 in Tier 3, both with more than 10,000 available votes. As you look at these two charts, the shift is unmistakeable. There aren’t a tremendous amount of votes to be won or lost, but re-engaging with these communities, some of the most diverse in the state, is essential.
Maverick County - Ranked 66th in registered voters with 33,050
34.1% Republican in 2000
44.8% Republican in 2020 (10.7 increase)
17,706 Registered Non-Voters
Starr County - Ranked 62nd in registered voters with 34,050
22.6% Republican in 2000
47.1% Republican in 2020 (24.5 increase)
16,524 Registered Non-Voters
So what am I boiling this all down to? It’s simple.
We have limited resources. Push them where you can make the most difference.
What does that look like when you plot this on the Texas map?
These are the places Democrats have to zero in on to win in a statewide election. These 33 counties are where the votes are there to shift races and make a real difference. There are some counties I’d put into a Tier 4 if there was real investment into Texas, but based on where we’ve been before, it’s been promised but slow to show up, if at all.
There are Democrats in the 221 counties I’m not focusing on who are looking for help. The Texas Democratic Party should be providing those local county’s parties guidance on best practices, helping candidates make the best showing possible. But the real investment of time and money MUST be directed. We’ve seen 254 county focus, looking to flip voters from one side to the other. It didn’t work.
We have to look to the new and non-voters. Once they engage with a strong candidate, a message that gives them something to connect with, and importantly regular communication to help them understand how to navigate the process and when / how to vote, they will make the difference.
Boiling it all down, this is how I see it:
Focus Young. Focus Urban / Suburban. Focus Diverse.
If we want to win, we have to know when and where to fight.
See it. Name it. Fight it.


I’m in Lubbock and am so thankful to see us listed! We were told last year that Lubbock was on TDP list of top 15 counties to watch, but the overall support is sorely lacking. Kim Gonzalez and Josh Shankles were elected as the new CD 19 SDEC reps, and they are rockstars!
This, thank you for highlighting Montgomery County. We get overlooked often because we are so red, but we have moved 10 points in 10 years, but we have also doubled in size as one of the largest counties (12th). If we can bump our numbers by even 5%, we know the rest of the state is coming with us!
But no support outside of our own people despite me banging on the table for my six years as chair and 4 more as a leader in the MCDP.