Numbers via things like population changes, increasing diversity, vote outcomes, these all give a sense of where things are heading. There are folks who see it happening and are doing everything they can to stop it. They are looking backwards, trying to maintain their hold on power, on dominance in society. If we want to ensure everyone has a seat at the table and all voices are heard and valued, we have to focus for the future.
In a time where there are limited resources to drive change, we have to understand the dynamics at play and how or if they have changed over time. I originally laid what follows out for presentations in December of 2022. It is all still relevant. We still have time to:
Focus where people are
Understand who is on our side in those places
Figure out ways to get them to engage, even a little
Get enough engaged we can counteract the ideology attempting to take over the State
Be skeptical of anything taking from 1-4
Let’s dig in!
We have to start with outcomes of elections. We will look only at Presidential elections.
2000 - 38.0% Dem v 59.3% Rep (George Bush)
2004 - 38.2% Dem v 61.1% Rep (George Bush)
2008 - 43.7% Dem v 55.5% Rep (John McCain)
2012 - 41.4% Dem v 57.2% Rep (Mitt Romney)
2016 - 43.2% Dem v 52.2% Rep (Donald Trump)
2020 - 46.5% Dem v 52.1% Rep (Donald Trump)
There is a trend that shows Texas moving closer to blue. But Texas is a big state. It isn’t getting blue everywhere. I’m going to show you some trends on votes for Republicans and the diversity of the population. I think you will see the same thing I do.
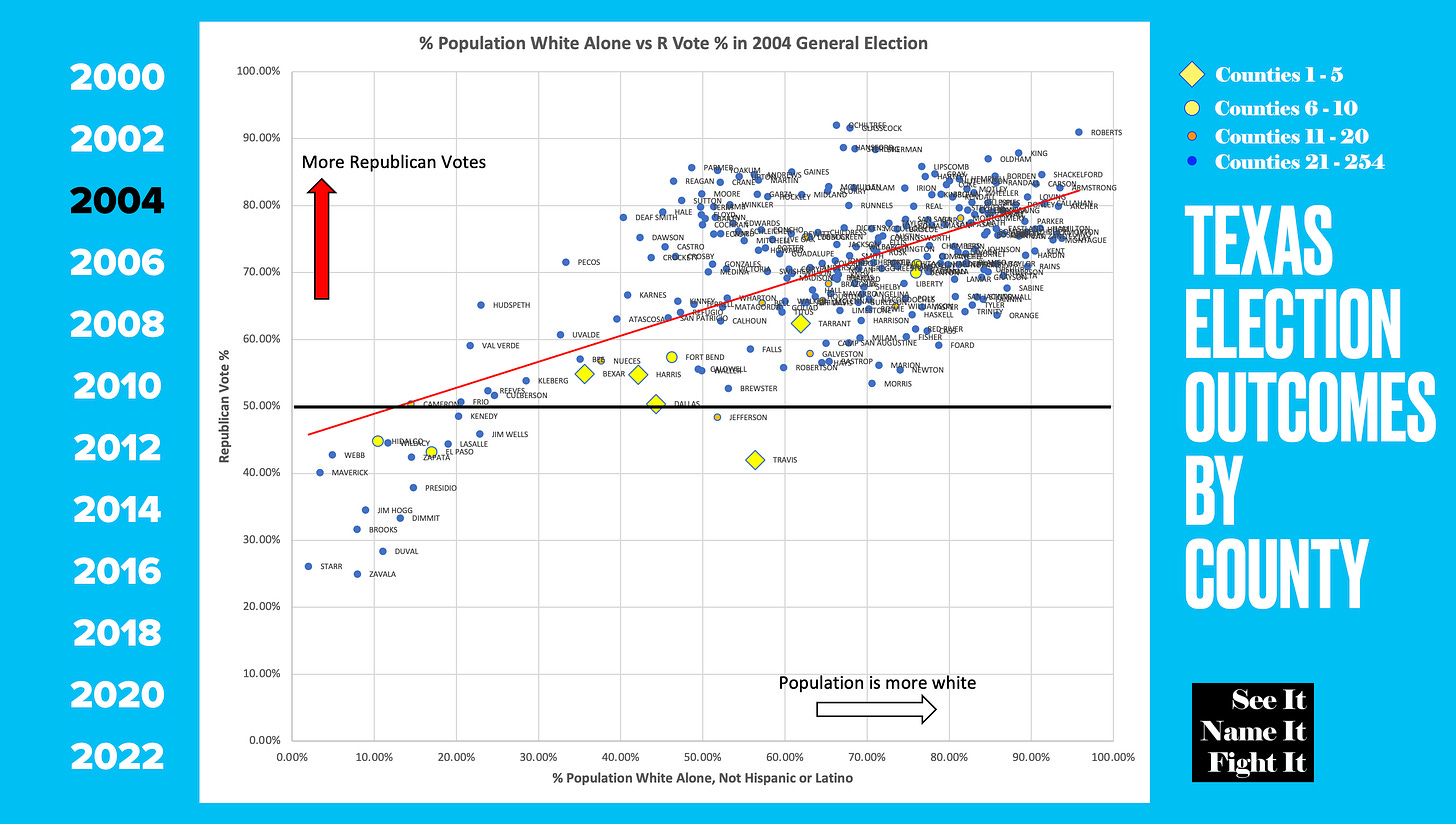
We will start with 2000 and plot all 254 counties, their voting outcomes and their % of population identifying as White Alone, Not Hispanic or Latino (as collected by the US Census Bureau). I know it can a lot to try and take in, with 254 dots on a graph, so I’ve added a trend line to help. By and large, as a county has a population that is more “white”, they vote more Republican.
On the chart above, you can see Starr County, which was only around 3% “white alone”, were at 22% of the vote for Republicans. On the other end, you can see Roberts County, at almost 96% “white alone” and 86% of the vote for Republicans.
Pushing to 2004, the trend overall stays consistent, but some of the biggest counties in the state start to separate from the cluster.
The overall trend line actually slide up a little, with a few points of movement toward Republicans.
In 2008, things change more dramatically.
The trend line itself tipped up, as Democrats picked up significant ground in diverse and large counties. Four of the top five counties in Texas voted for Obama. And those smaller counties with less diverse populations? They pushed more toward Republicans. Hmmm, I wonder why? (Not really)
In 2012, with a fresh Census reflecting the diversity of the Texas population accelerating, the overall slope of the trend stays consistent, but you can see how all dots have shifted to the left.
Notice there is a slight repositioning of the line, up just a few points, and the trend line peaks over 90% for the first time in those counties that are the least diverse.
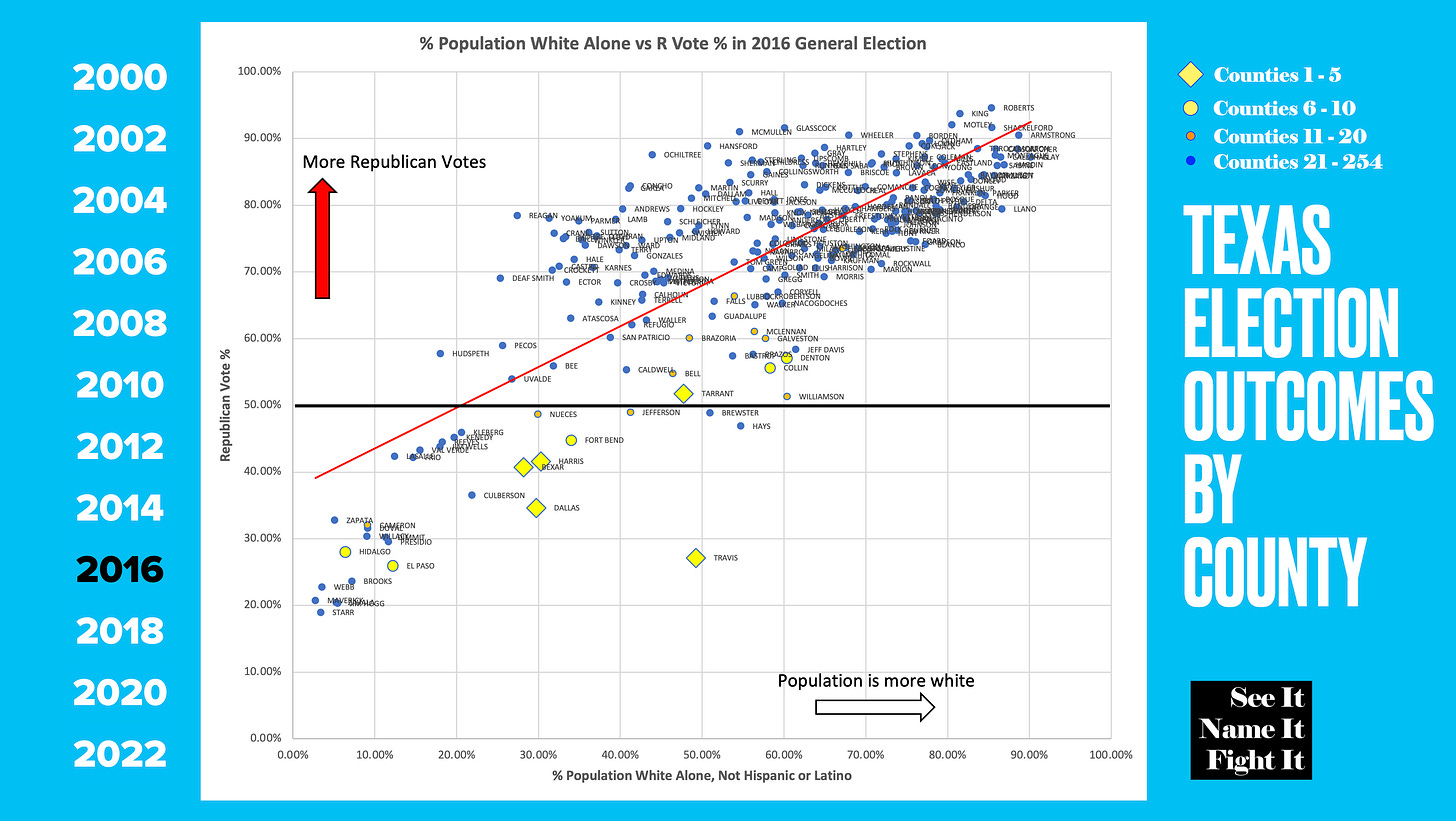
2016 is Hilary Clinton and Donald Trump.
Look at how the clusters are getting even tighter on the smaller, less diverse counties, voting more Republican than ever, while the largest counties (1-10) separate from the mass. Even counties 11-20 have largely separated from the clumps, so while still voting Republican, as they get more diverse, they vote less red.
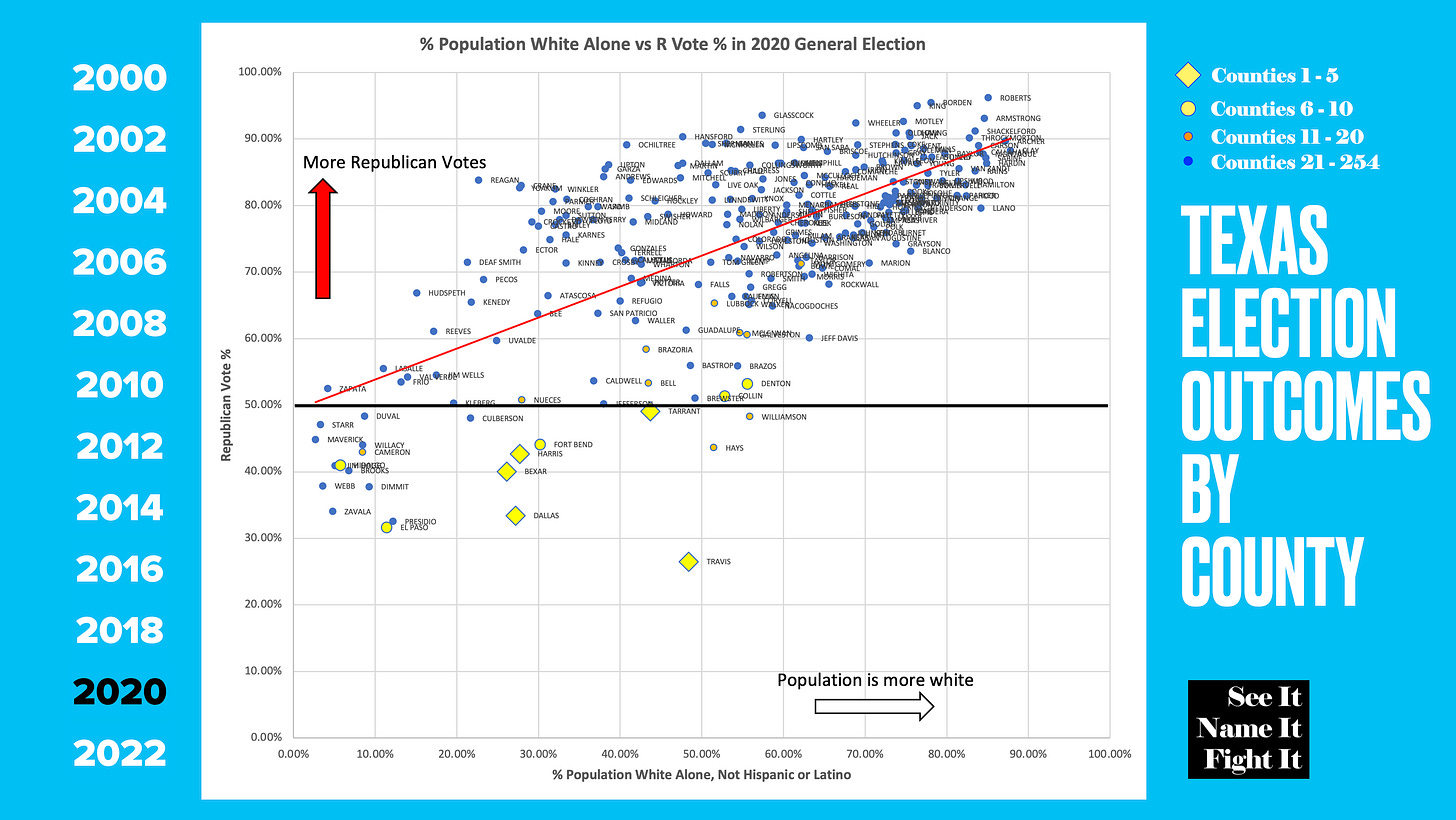
2020 is Joe Biden and Donald Trump.
This one is interesting, as the top of the trend line is still sitting at 90 percent, but notice the bottom of the line is sitting right on 50 percent. There was a change in those highly diverse counties, mostly along the Rio Grande Valley, pushing more Republican. But on the overall outcomes, the biggest counties in the state more than offset the losses, pulling the state to its closest overall outcome yet.
Looking back across the past six Presidential elections, it is remarkable how consistent the trend has been.
We hear about the population booming in Texas, with people moving here in droves. But it is a big state. Where are they moving?
Hint: It isn’t rural areas.
Texas has 254 counties.
Since 2000:
The largest 20 counties have gained 4,173,906 registered voters. That’s a 49.6% increase
Counties 21 to 50 have gained 796,069 registered voters. That’s a 43% increase
Counties 51 to 100 have gained 310,906. That’s a 27% increase.
The other 154 counties? They have gained 26,027, just a 2.7% increase, and many of those counties have actually LOST population.
Now we can definitely say we know that Texas is not gaining population in all places at the same rates.
But how do they vote? Are their trends as consistent? Yep.
Counties 1 - 20 have in aggregate consistently moved more blue as they have gained more population, 12 points overall.
Counties 21 - 50 have moved 3 points towards Republicans in the past six Presidential elections.
Counties 51 - 100 have moved 9 points towards Republicans.
Counties 101 - 254 have moved almost 11 points towards Republicans.
If we know that the largest 20 counties are consistently voting “bluer”, what share of the votes cast come from those 20 largest counties? It’s a LOT
The top 20 counties made up 67% of the votes in 2000. In 2020, it was up to 72%. For those smallest 154 counties, they only made up 6% of the votes in 2020.
I mean, I think we all knew the big counties were bigger, but when you see 20 counties driving such a large part of the vote share, and those 20 counties are moving on the whole more toward Democrats, you understand why the GOP is proposing an electoral college style system for Texas. There are 234 counties that don’t have much say on the overall if the top 20 align on a direction and drive turnout.
Texas has been known as a non-voting state. When you look at Presidential election voter turnouts, we’ve mostly lived up to the claim. But something did happen in 2020. Texas finally got into the sixties. And notice how the 20 biggest counties went from 51.1% turnout in 2000, which was the lowest data point, jumping to the top turnout group in 2008, and maintaining that slot ever since.
And now that we all know what outsized influence those top 20 counties have on the state, what if their turnout jumped a few points? It has a whole lot more impact than the smallest 154 counties seeing their turnout jump the same few points.
Just how close was the 2020 election?
Wow. Over 5 million non-voters. And a 631,221 difference between Trump and Biden in the state. Get 20% of the non-voters to cast a ballot, which takes the turnout from 66.7% to 73.4%, it adds 1,128,093 votes to the totals. And if those 20% more votes are coming from the big blue diverse counties, well, we have a horse race. This threatens Republicans hold on power. It also tells us exactly where Democrats MUST focus their attention.
Here is the caveat. All counties in Texas are becoming more diverse. That is a reality. But some counties get more diverse and embrace it. Others get more diverse and rage against it, trying to protect their power and “purity”. Those with larger populations that have always had some level of diversity lead the way, driving blue. Those who were bastions of “whiteness” see the change happening around them and go ever more red.
Ok, so then where do we need to focus? Which specific counties?
That’s Part Two. Subscribe to make sure you don’t miss it. (Or just click this link!)
See it. Name it. Fight it.


Fascinating. Can't wait for part 2.
Thanks for a very informative article.