
The March Signal
What Texas Primary Turnout Has Been Telling Us All Along — And What 2026 Is Screaming Right Now

It’s always interesting when Bo French can lead off a piece. So this will be fun. And probably lots of numbers. Just warning you before we jump in.
Every election cycle, Texas political observers wait for November to tell them what happened. I’m here to argue you don’t have to wait that long. The signal comes in March. And in 2026, it came in loud.
This piece is about a simple metric, what it has predicted across more than a decade of Texas elections, and what the final numbers from Tuesday’s primary tell us about November. To understand why those numbers matter, you need the historical framework first.
The Metric: What the D/R Ratio Measures
Texas doesn’t have party registration. Every primary voter makes an active choice. They walk in and ask for a Republican ballot or a Democratic ballot. That choice, aggregated across millions of Texans, tells you something real about the state of partisan energy heading into November.
The metric is simple: the ratio of Democratic primary votes to Republican primary votes, the D/R ratio. When it approaches or exceeds 1.0, Democrats are matching or beating Republicans in primary participation. When it sits well below 1.0, Republicans are dominating the enthusiasm race before the general election even begins. Another way to think about it, if the ratio is 0.70, that means for every 100 primary votes Republicans received, Democrats got 70 votes. Or a 1.10 means for every 100 Republican votes, Democrats received 110. Make sense?
I tracked this ratio across every Texas primary cycle back to 2010, split into two tracks, midterm years and presidential years, because they behave very differently.
The Midterm Track: Where the Signal Is Clearest
Midterm electorates are base-driven. Without a presidential race at the top of the ticket, primary turnout is a purer measure of which party’s core is fired up. Four cycles of data tell a consistent story:
2010: D/R ratio 0.47. Governor’s race. Republican margin +12.8 points.
2014: D/R ratio 0.42. Governor’s race. Republican margin +20.4 points.
2018: D/R ratio 0.69. Senate race. Republican margin +2.6 points.
2022: D/R ratio 0.58. Governor’s race. Republican margin +10.9 points.
2026: D/R ratio 1.07. Senate race. What will the margin be?
The relationship is not subtle. Every 0.10 increase in the D/R ratio corresponds to roughly 5 to 7 points of narrowing in the November margin. That is not a coincidence. That is a structural relationship that has held across four consecutive cycles.
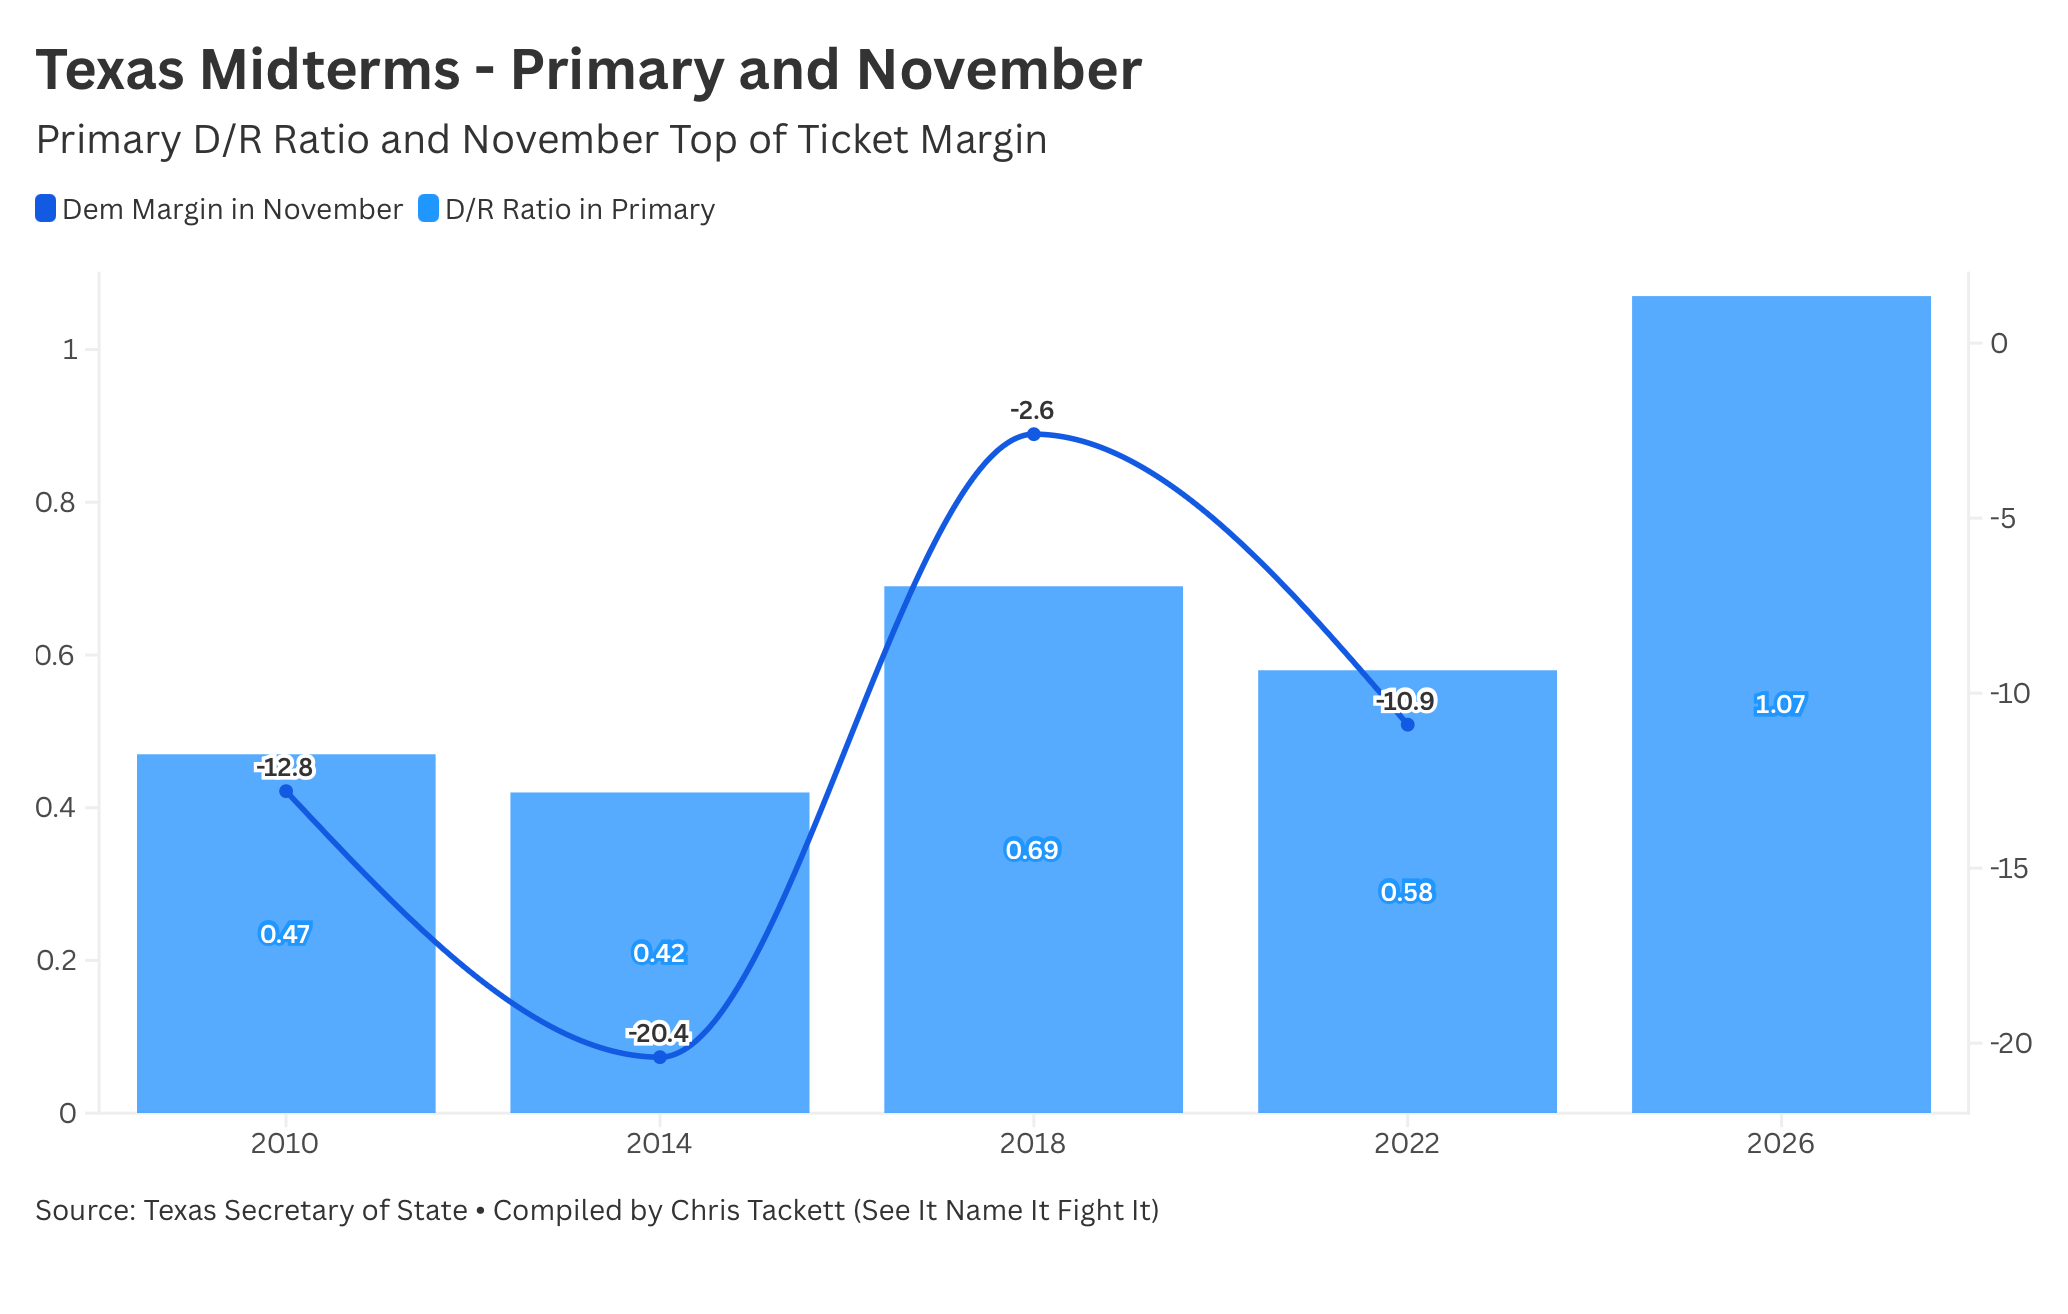
Extend that trendline to a ratio of 1.07 and the framework doesn’t just predict a competitive Texas Senate race in November. It predicts a race where Democrats enter as the structural favorite for the first time since Ann Richards won the governorship in 1990. Yeah, I wrote what I wrote. The data is the data.
The Presidential Track and Why It’s Different
Presidential years follow a different structural logic, and understanding why requires separating two things that are easy to conflate: the presidential year effect, and the Trump effect within it.
The presidential year effect exists independent of Trump. A presidential race at the top of the ticket drives both parties’ base voters to the primary in ways a midterm simply doesn’t, which raises the raw volume on both sides and suppresses the D/R ratio by definition. But Trump amplifies this effect dramatically on the Republican side, generating GOP primary volumes of 2.8 million in 2016 and 2.3 million in 2024 that raise the threshold Democrats need to clear just to achieve parity.
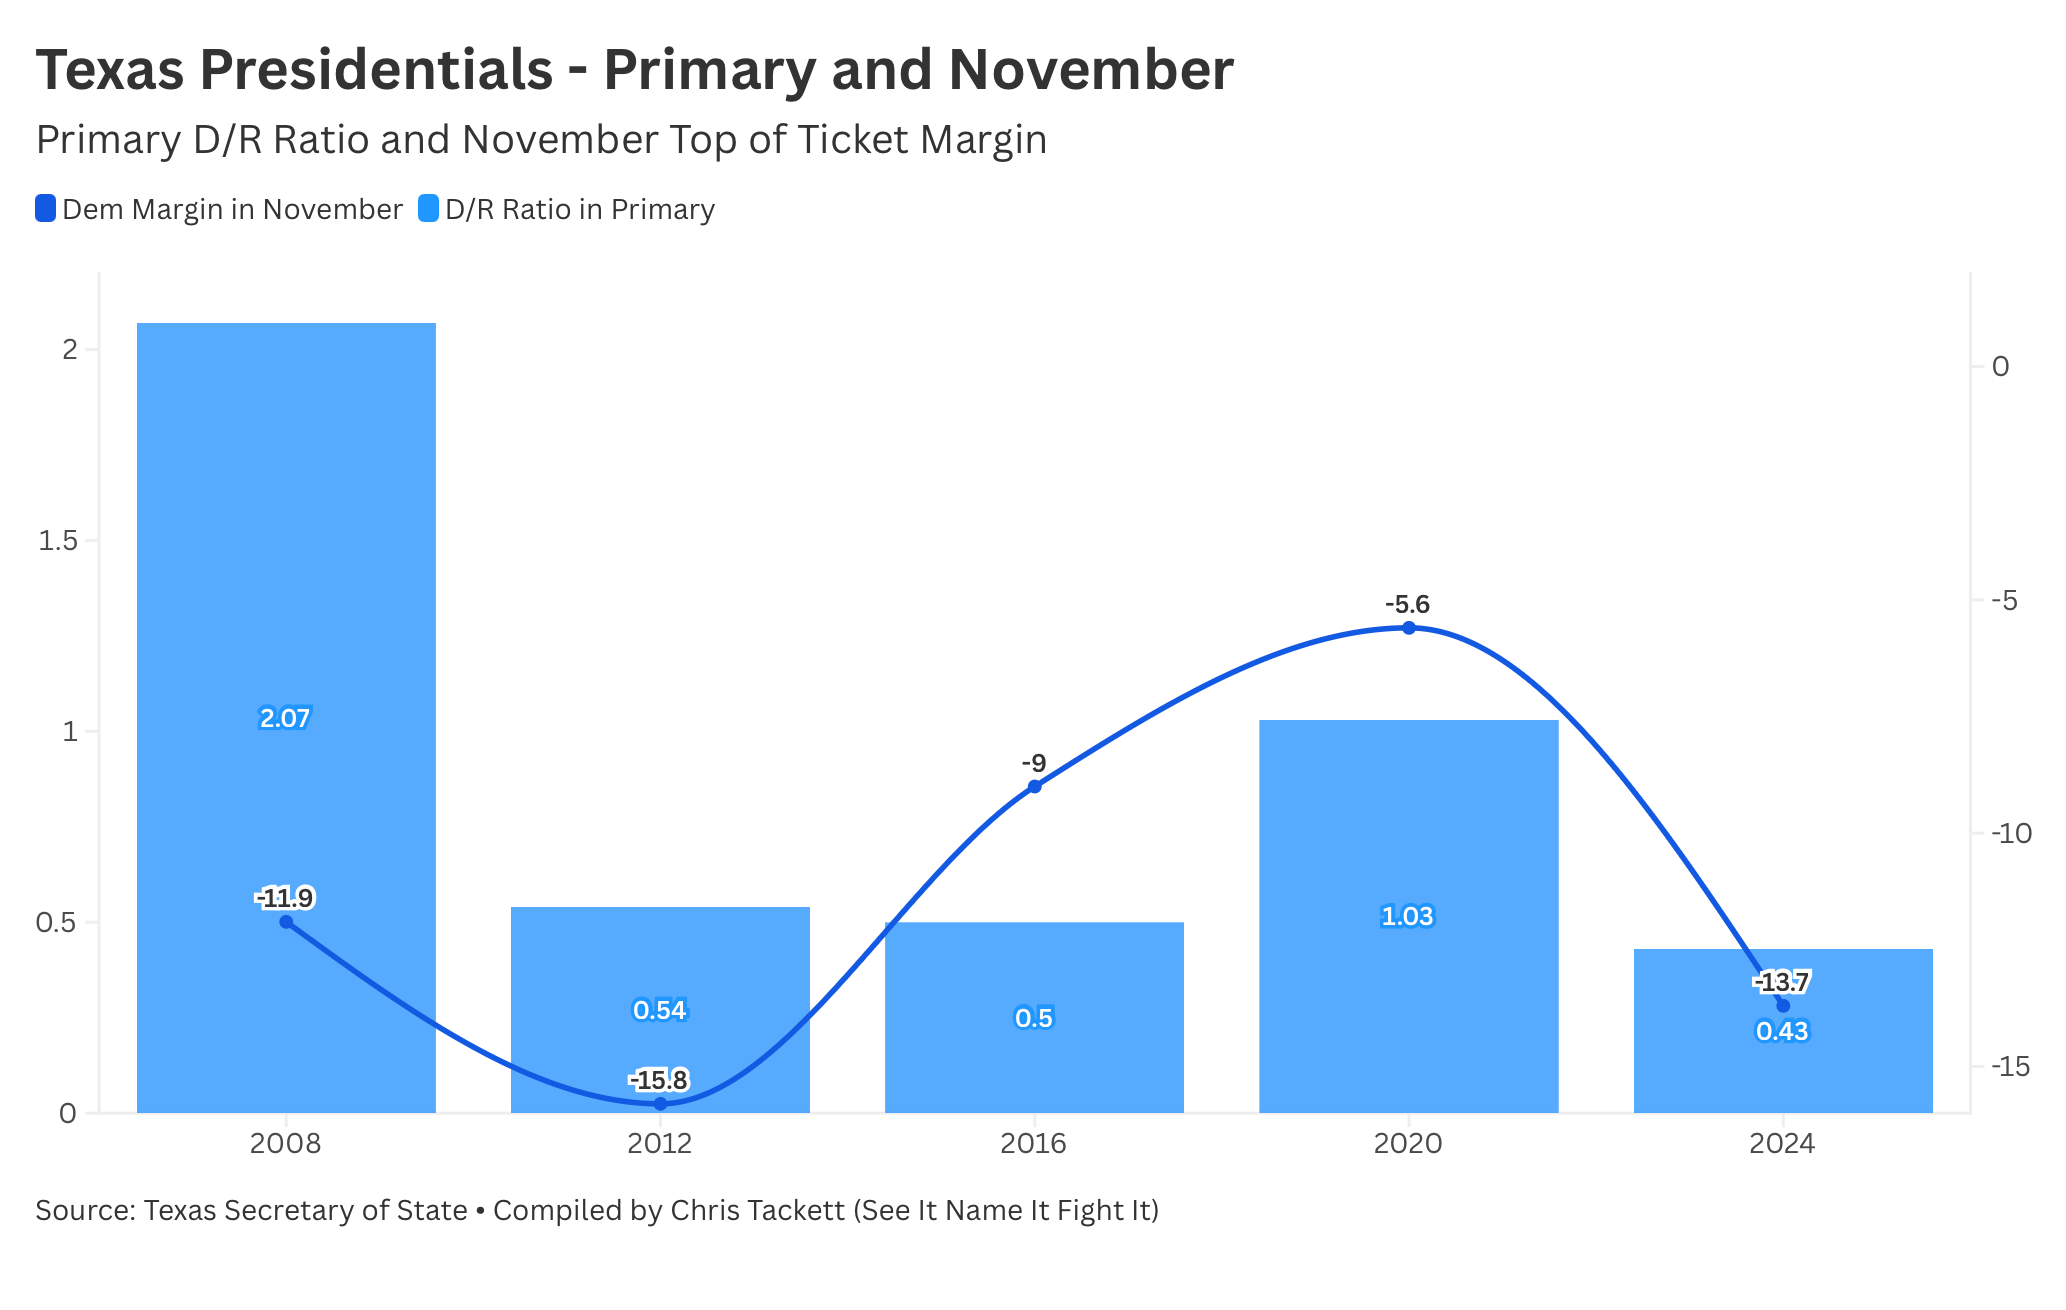
Even so, the framework holds directionally across presidential years:
2016: D/R ratio 0.50. Republican margin +9.0 points (Trump).
2020: D/R ratio 1.03. Republican margin +5.6 points (Trump).
2024: D/R ratio 0.43. Republican margin +13.7 points (Trump).
In 2020, Democrats matched Republicans in primary turnout and November was the closest presidential result in Texas in decades. The ratio matters across both tracks. The threshold is just significantly higher in presidential years, likely above 1.3, before Democrats can realistically compete for a win.
Democrats just posted a midterm primary ratio of 1.07. Higher than the 2020 presidential ratio that produced the closest Texas result in a generation. Let that sink in.
Two Outliers, One Explanation: 2008 and 2012
Two presidential cycles sit outside the framework entirely and deserve explanation.
In 2008, Democrats posted a ratio of 2.07 and McCain still won Texas by nearly 12 points. In 2012, the ratio was 0.54 and Romney won by a staggering 15.8 points, far larger than the trendline would predict. Both numbers are real. Both are misleading if you take them at face value. And both have the same underlying explanation.
The 2008 Democratic primary number was inflated by three distinct forces, each pulling in the same direction but for very different reasons.
The first was genuine Democratic enthusiasm. Barack Obama was generating real energy, real new voters, and real excitement across the country. Hilary Clinton was the first female nominee for President and immensely qualified for the role. That part was authentic.
The second was the ancestral Yellow Dog Democrats across East Texas and rural counties who had voted Democratic in primaries for generations out of habit and family tradition. The Clinton-Obama primary drew them out in enormous numbers. But many of those voters had no intention of supporting a Black candidate in November. When Obama secured the nomination, they sat out or crossed over to McCain. Their presence in the primary number was real. Their presence in the November coalition was not.
The third was Rush Limbaugh (and those like him). In the spring of 2008, Limbaugh was actively encouraging his listeners to cross over and vote in the Democratic primary for Hillary Clinton as part of what he called Operation Chaos, an explicit effort to prolong the Democratic primary fight and complicate Obama's path to the nomination. Republicans showing up in a Democratic primary to cause problems look identical in the raw data to Democrats showing up out of genuine enthusiasm. The ratio doesn't know the difference.
All three of those forces inflated the 2008 number. The last two were never going to show up for Obama in November. The primary ratio was a statistical artifact of three separate phenomena that happened to point in the same direction, and it predicted nothing about what came next.
That exodus didn’t complete itself in one cycle. Many of those voters sat out November 2008 rather than actively vote Republican. They weren’t quite ready to cross the aisle yet. By 2012, with Obama as the incumbent, and in the midst of the “Tea Party” movement, that ambivalence resolved. We saw a ratio of 0.54 and the racial resentment that had been simmering fully crystalized, and those voters turned out against him in force. Romney’s +15.8 point margin in Texas isn’t a normal presidential result. It is inflated by voters finishing their migration out of the Democratic coalition, casting what amounted to a resentment vote, without new coalitions being formed. The 2012 November number is an artifact of the same realignment that produced the 2008 primary anomaly, just playing out on the other side of the ledger.
By 2016, that migration was complete. The +9 Trump margin is the first presidential result that reflects the actual post-realignment Texas electorate. The predictive framework runs cleanly from 2014 forward in midterms and 2016 forward in presidential years. Everything before that is a different Texas.
Now look at 2026. There is no Operation Chaos running in the Democratic primary. There is no dying coalition going through its last motions. The voters showing up are younger, more female, more racially diverse, and more than four in ten of them are new to primary voting entirely. The 2008 inflation had three identifiable sources, only one of them durable. The 2026 surge has one source: people who want to vote Democratic and are doing it in record numbers.
Tarrant County: The Canary That Kept Singing
Before the statewide picture, Tarrant County (the largest “red” county in the country) deserves its own moment.
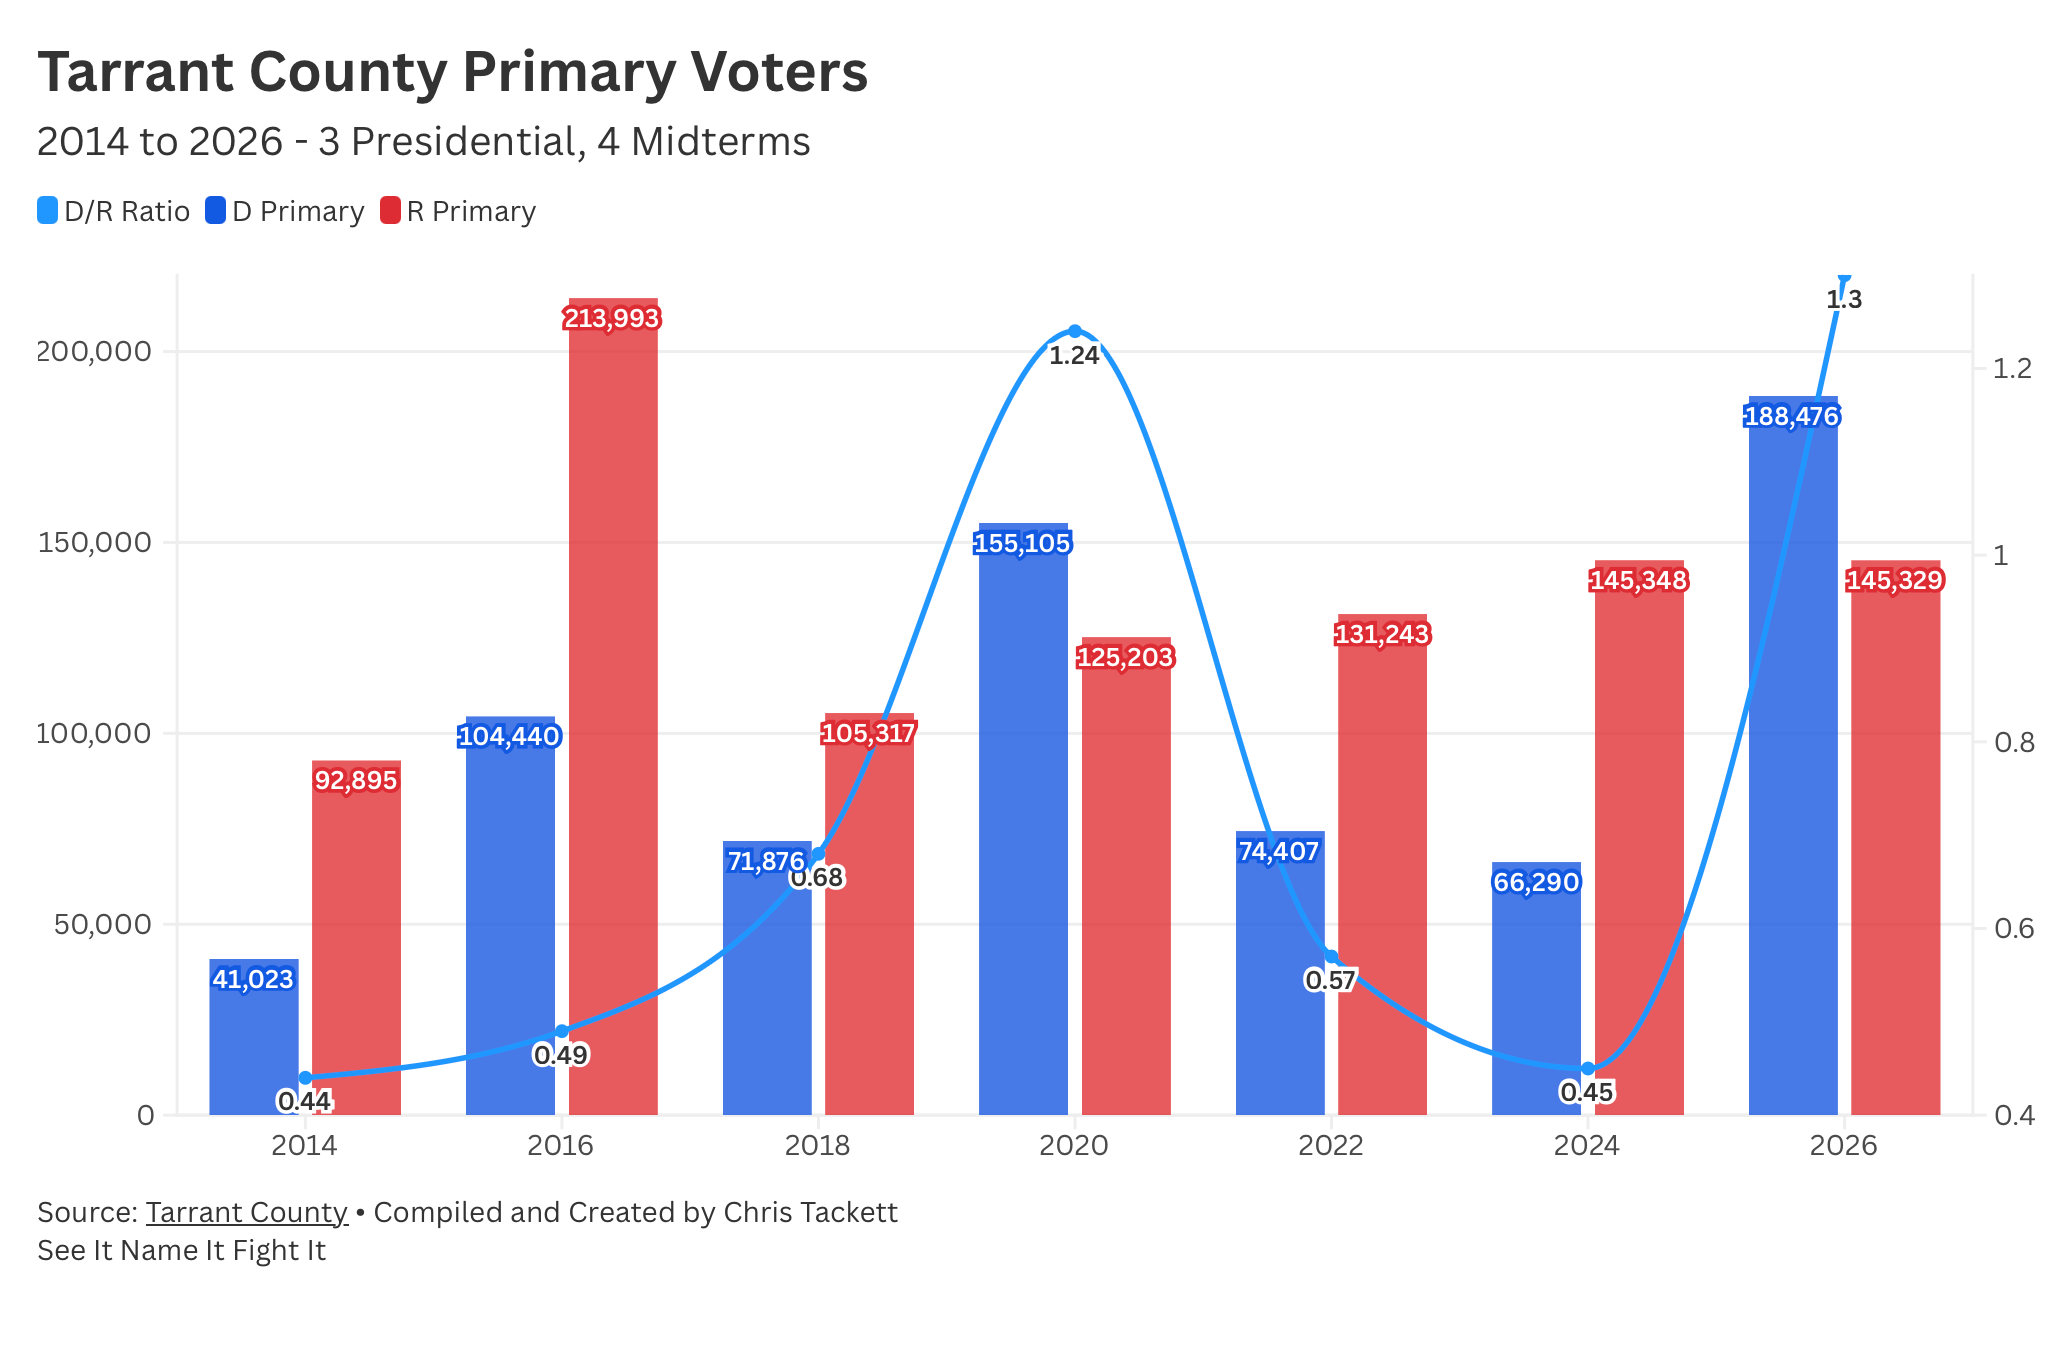
In every prior midterm cycle, Republicans led Democratic primary vote in Tarrant County. The ratio tracked the statewide pattern: 0.68 in 2018, 0.57 in 2022, 0.45 in 2024. November results tracked accordingly.
In 2026, Democrats cast 188,476 primary votes in Tarrant County. Republicans cast 145,329. The final D/R ratio: 1.3. For context, the highest ratio Tarrant County had ever recorded in any cycle, midterm or presidential, was 1.24 in 2020. Democrats didn’t just break the record. They shattered it, especially in a midterm.
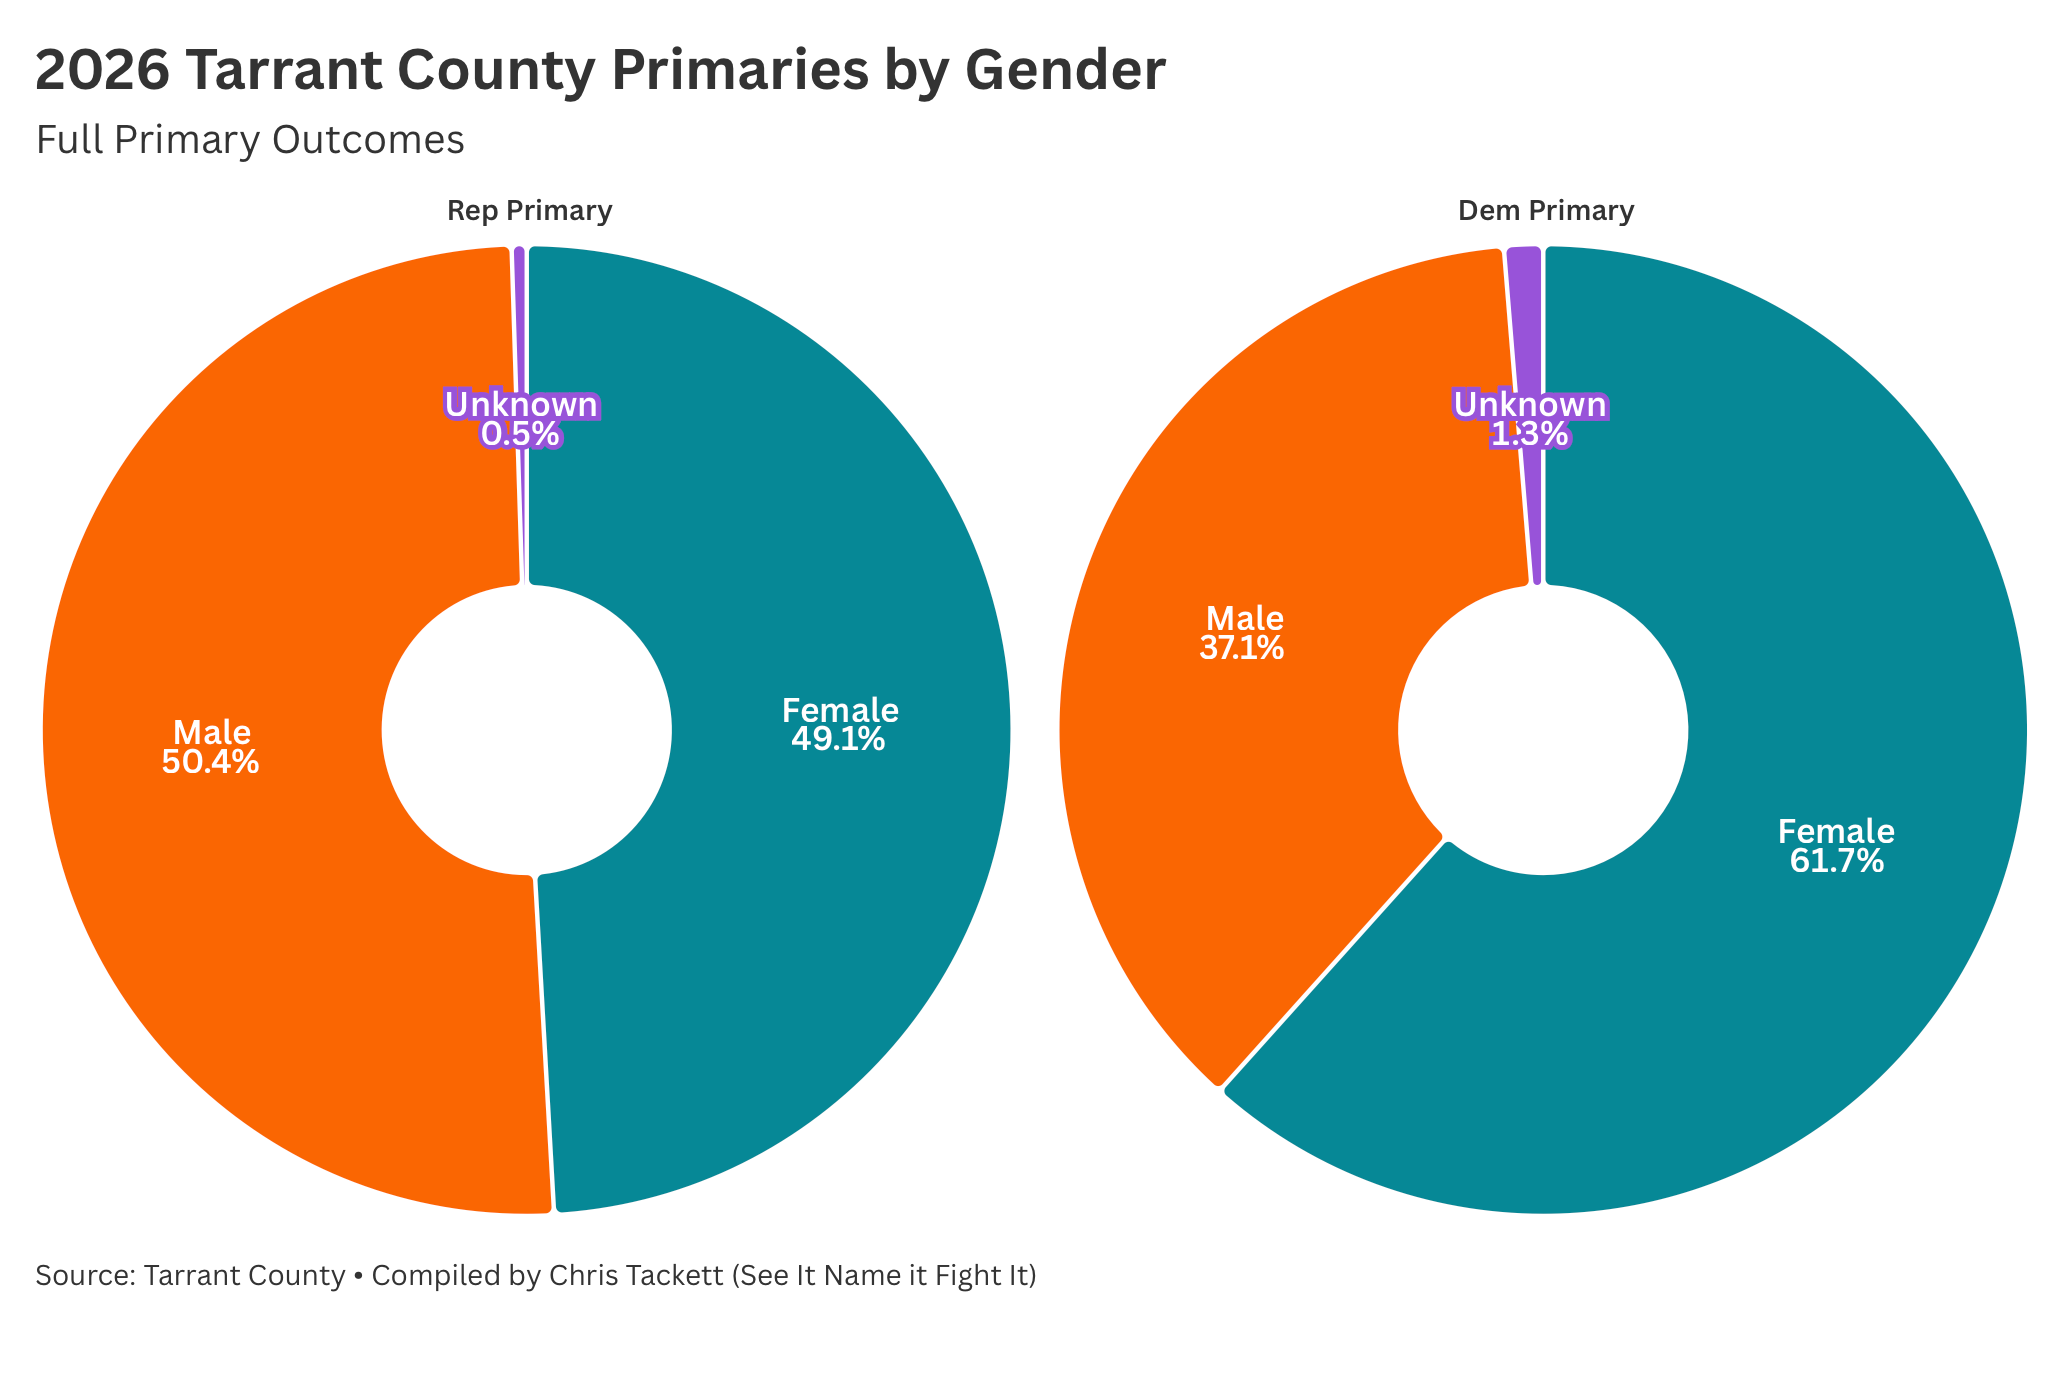
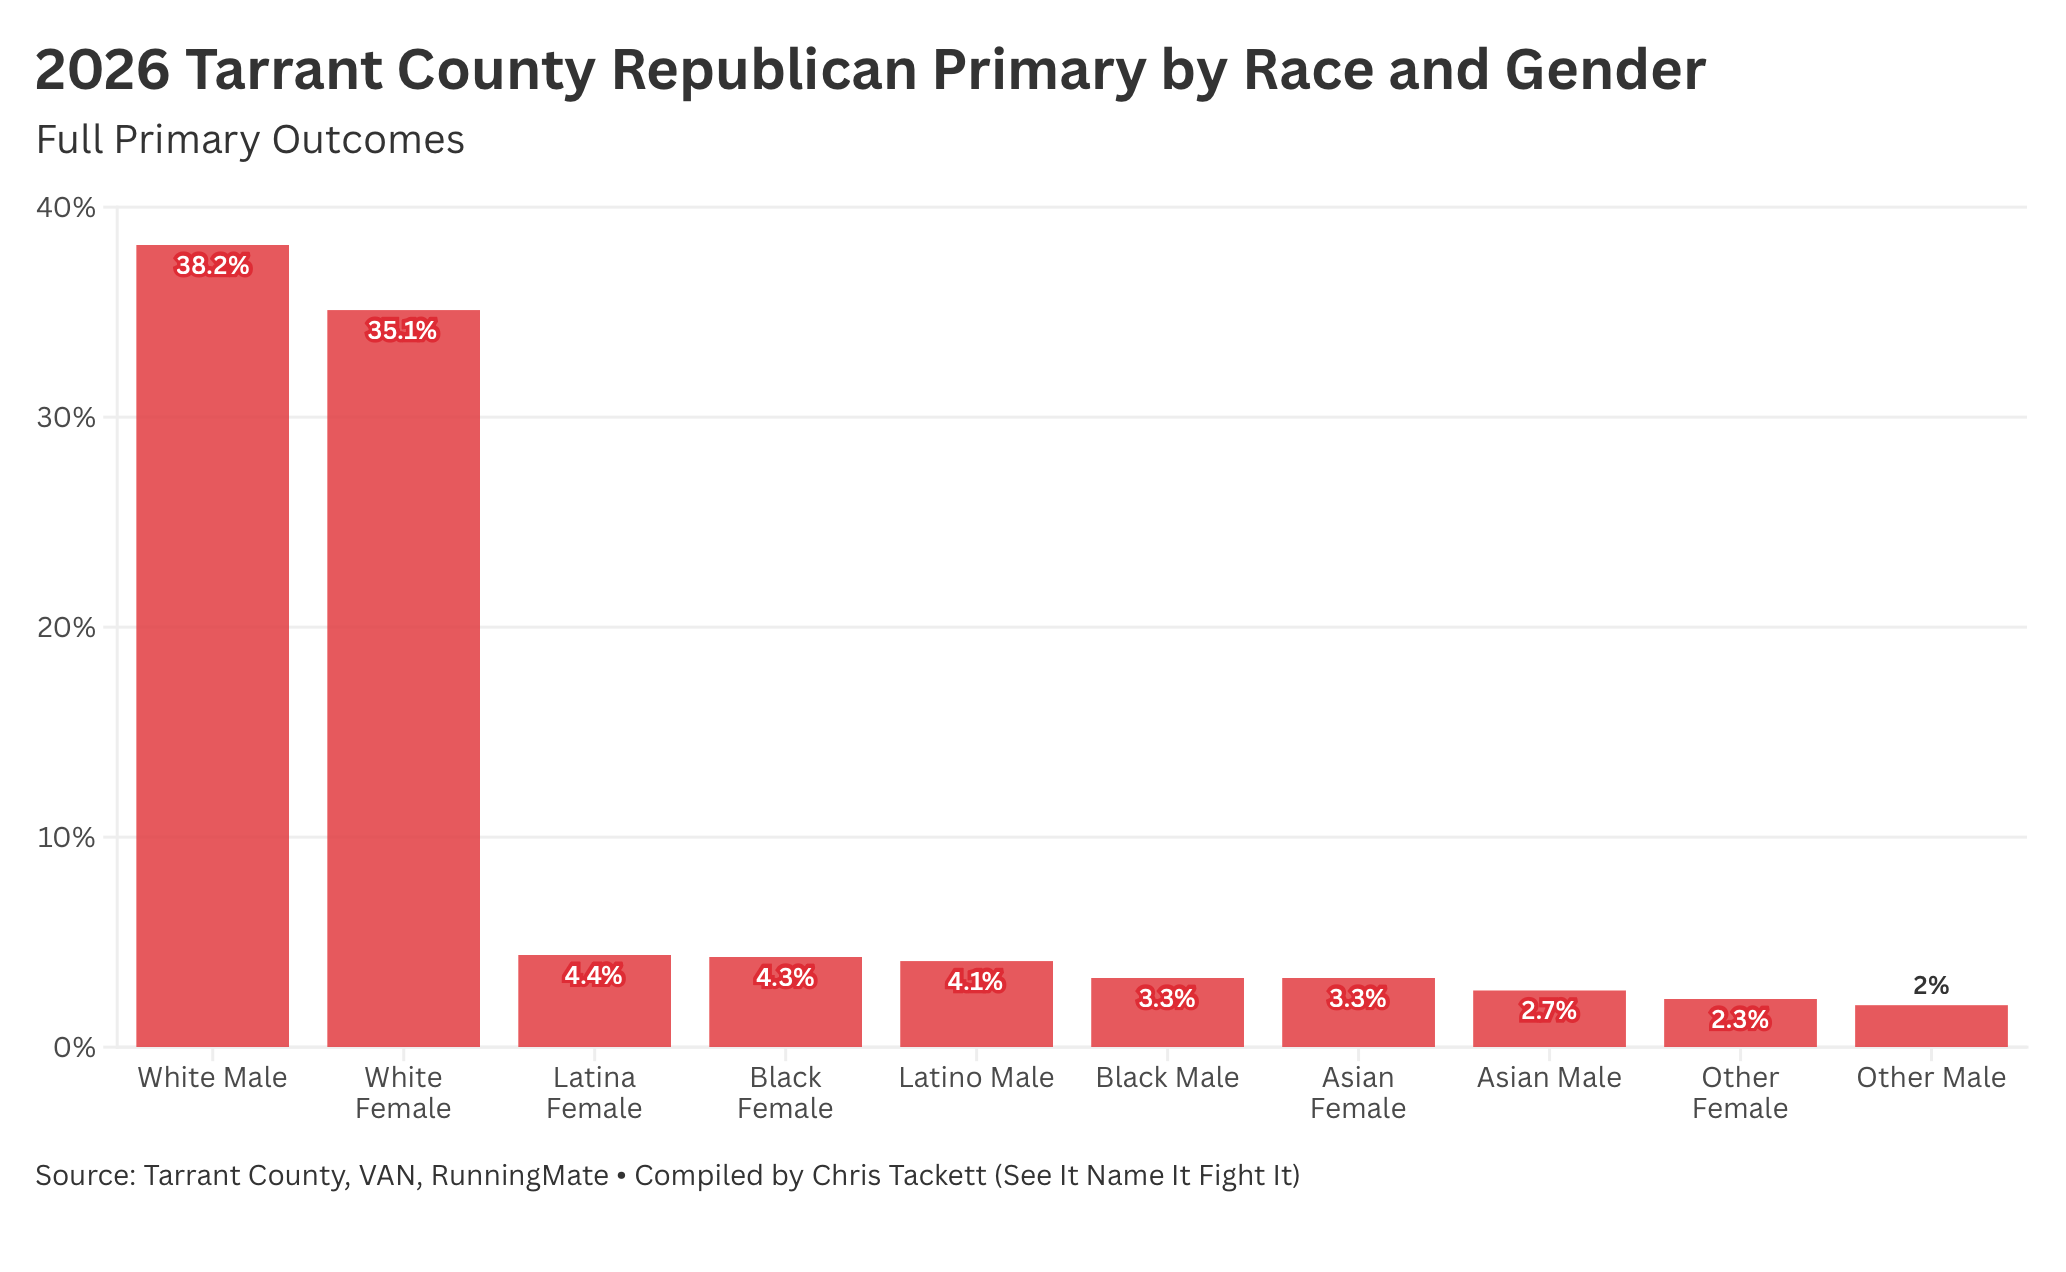
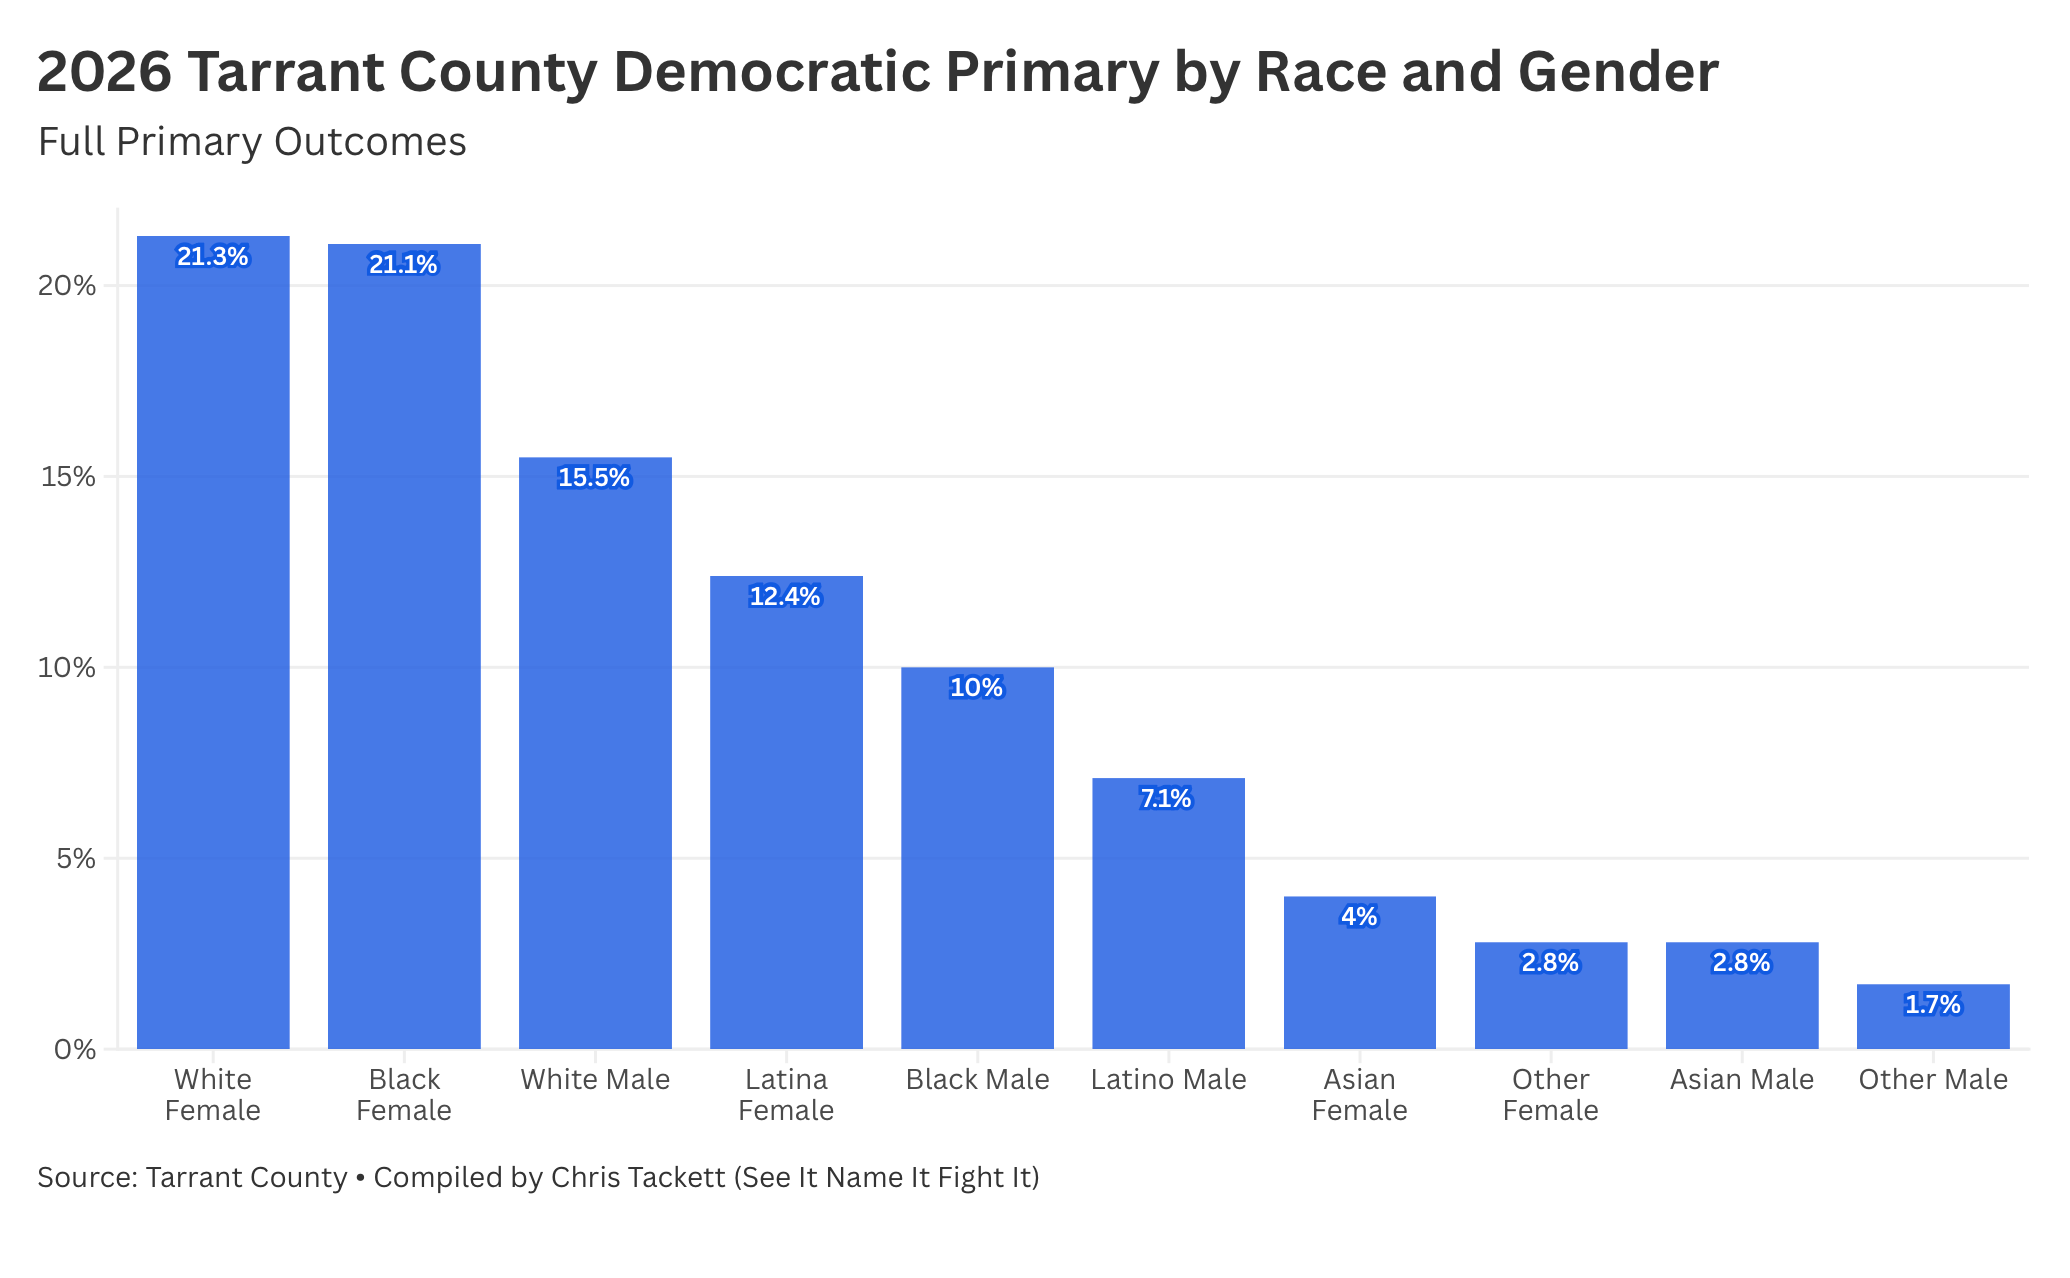
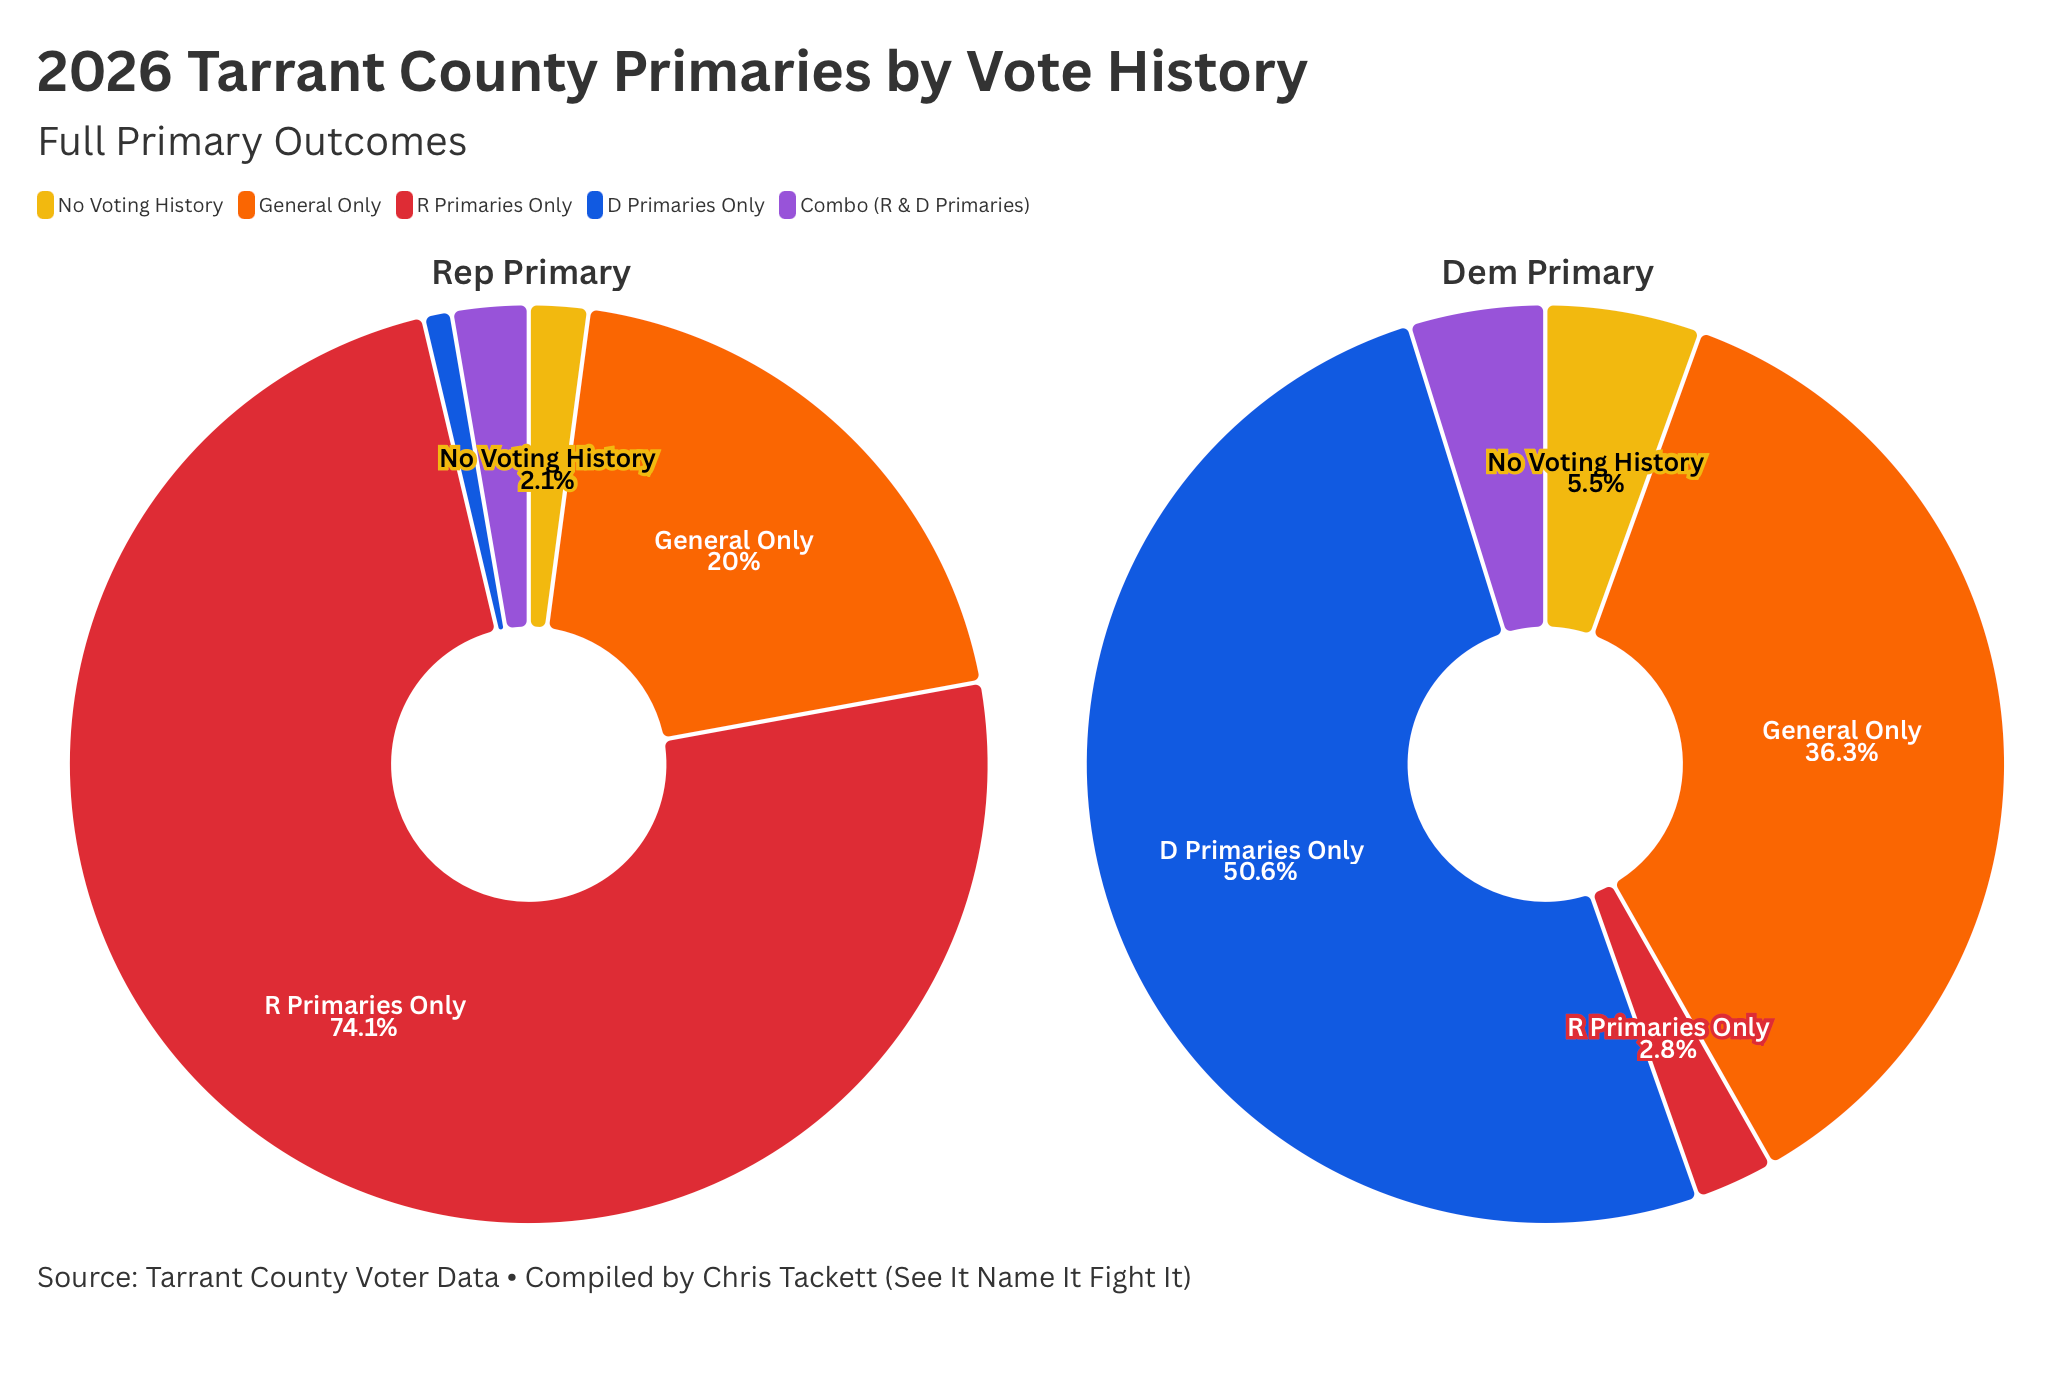
The composition of who showed up matters as much as the volume. Women cast 61.7% of Democratic primary ballots, compared to an essentially even split on the Republican side.
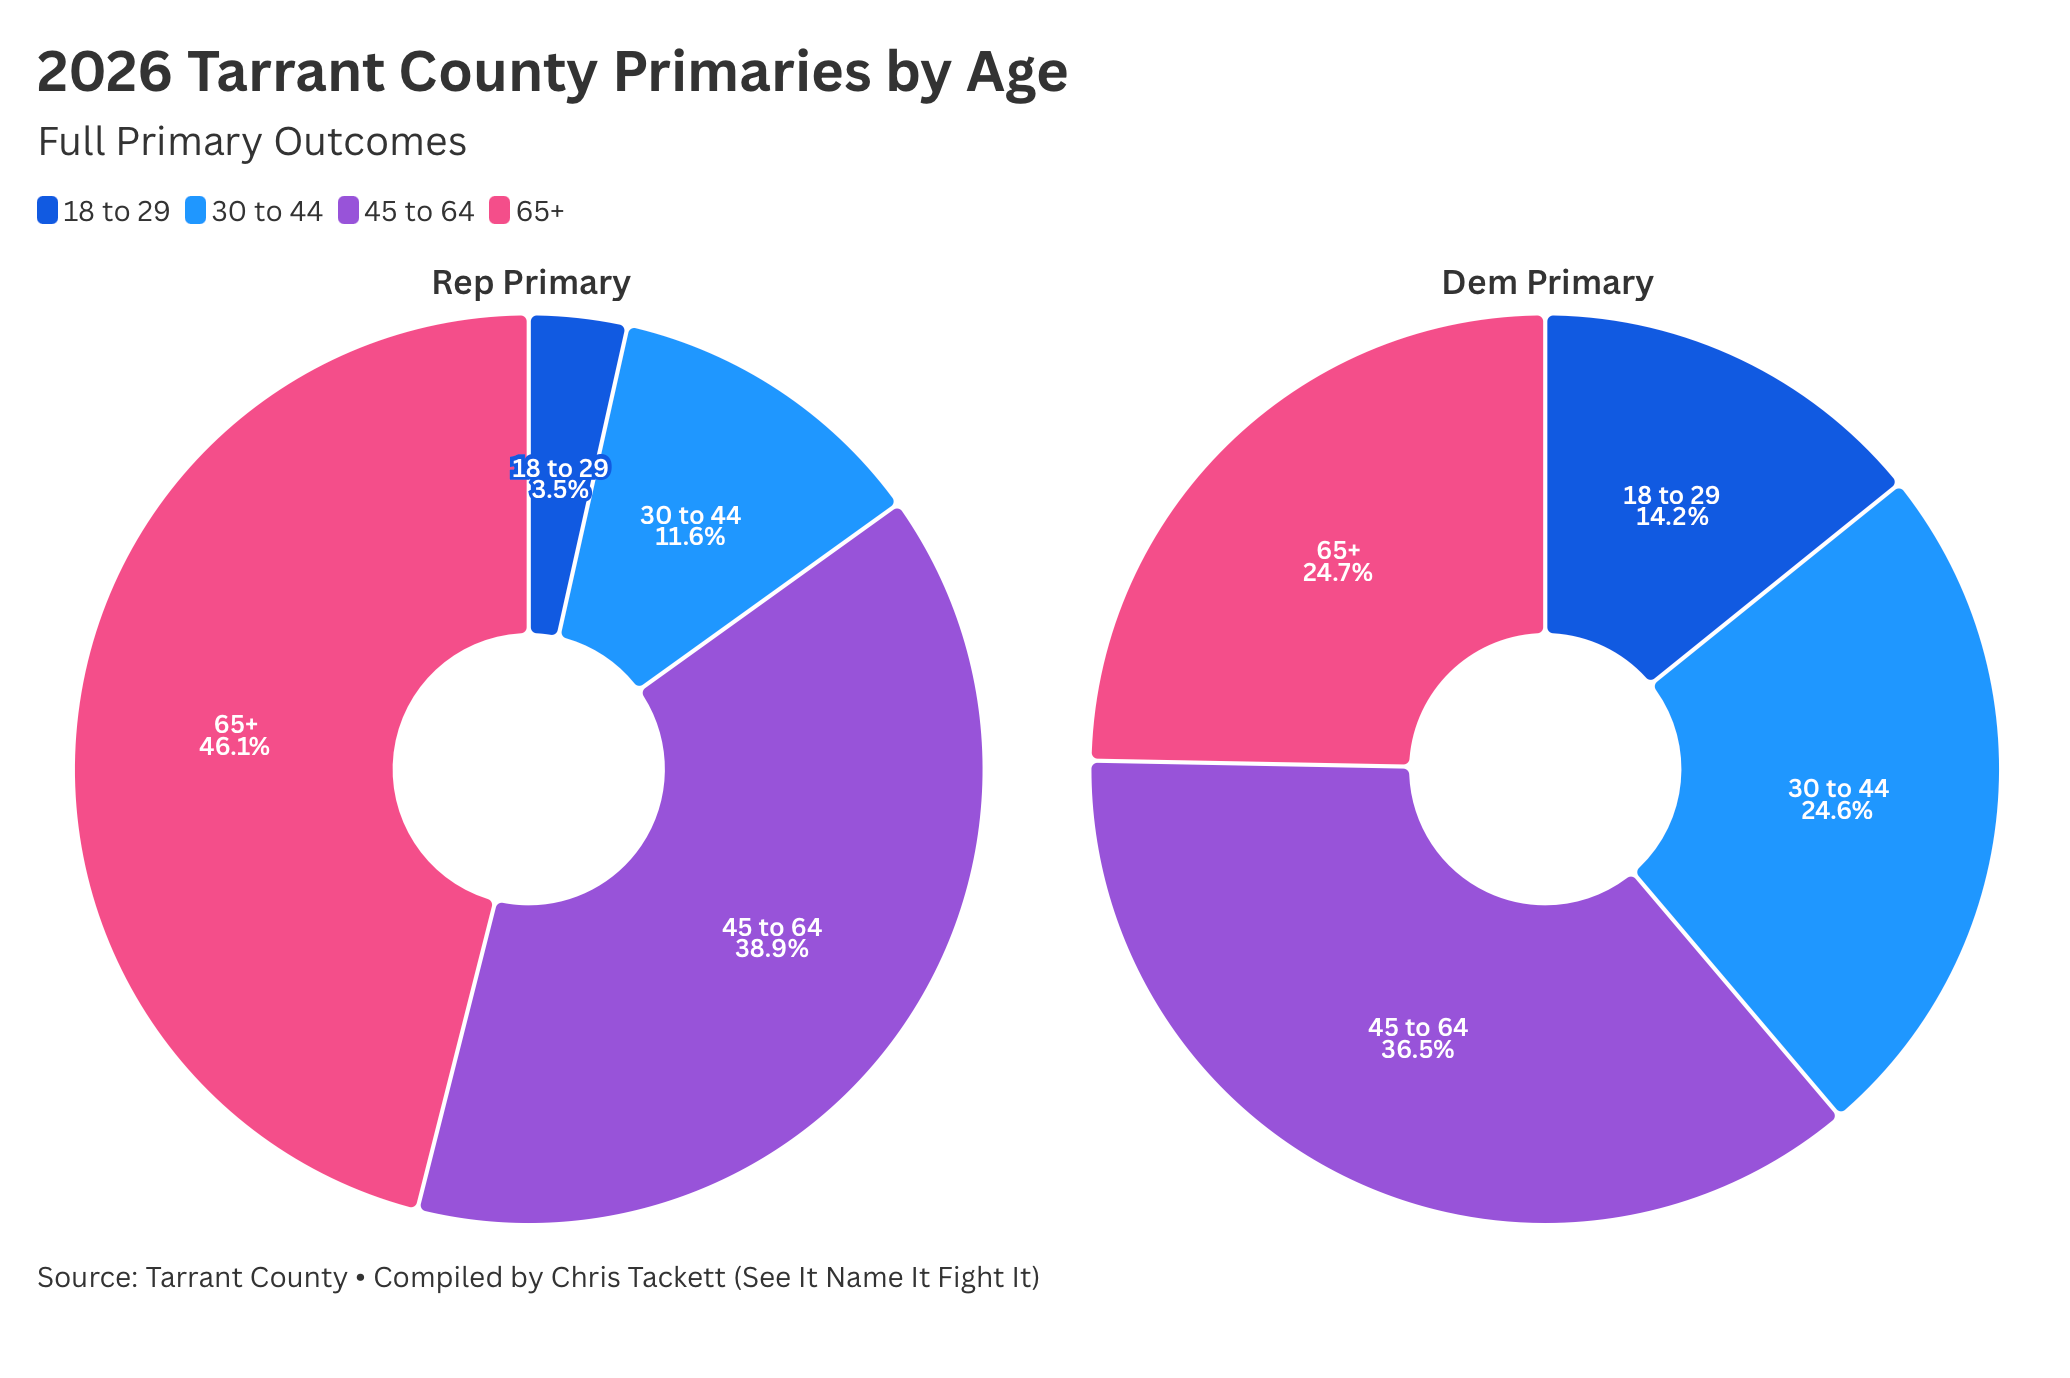
The Democratic primary electorate was younger, more racially diverse, and powered by a voter base that is genuinely new: more than four in ten Democratic primary voters in Tarrant County were either new to primaries or new to voting altogether. That is not a reshuffled coalition. That is a growing one.
The Statewide Picture
The Tarrant numbers are dramatic. The statewide numbers are historic.
When the final votes were counted on March 3rd, Texas Democrats had cast 2,311,813 primary ballots. Texas Republicans had cast 2,161,638. The statewide D/R ratio: 1.07.
Democrats outpaced Republicans in a midterm primary in Texas. Statewide. For the first time in the modern era of Texas politics.
To understand how extraordinary that is, consider the recent trajectory. In 2022, the ratio was 0.58. In 2024, it dropped to 0.43. Eighteen months later, in a midterm primary with no presidential race on the ballot, Democrats not only reversed that collapse, they cleared 1.0 for the first time in the modern era in a midterm and beat the 2020 presidential ratio of 1.03, which itself produced the closest Texas presidential result in decades.
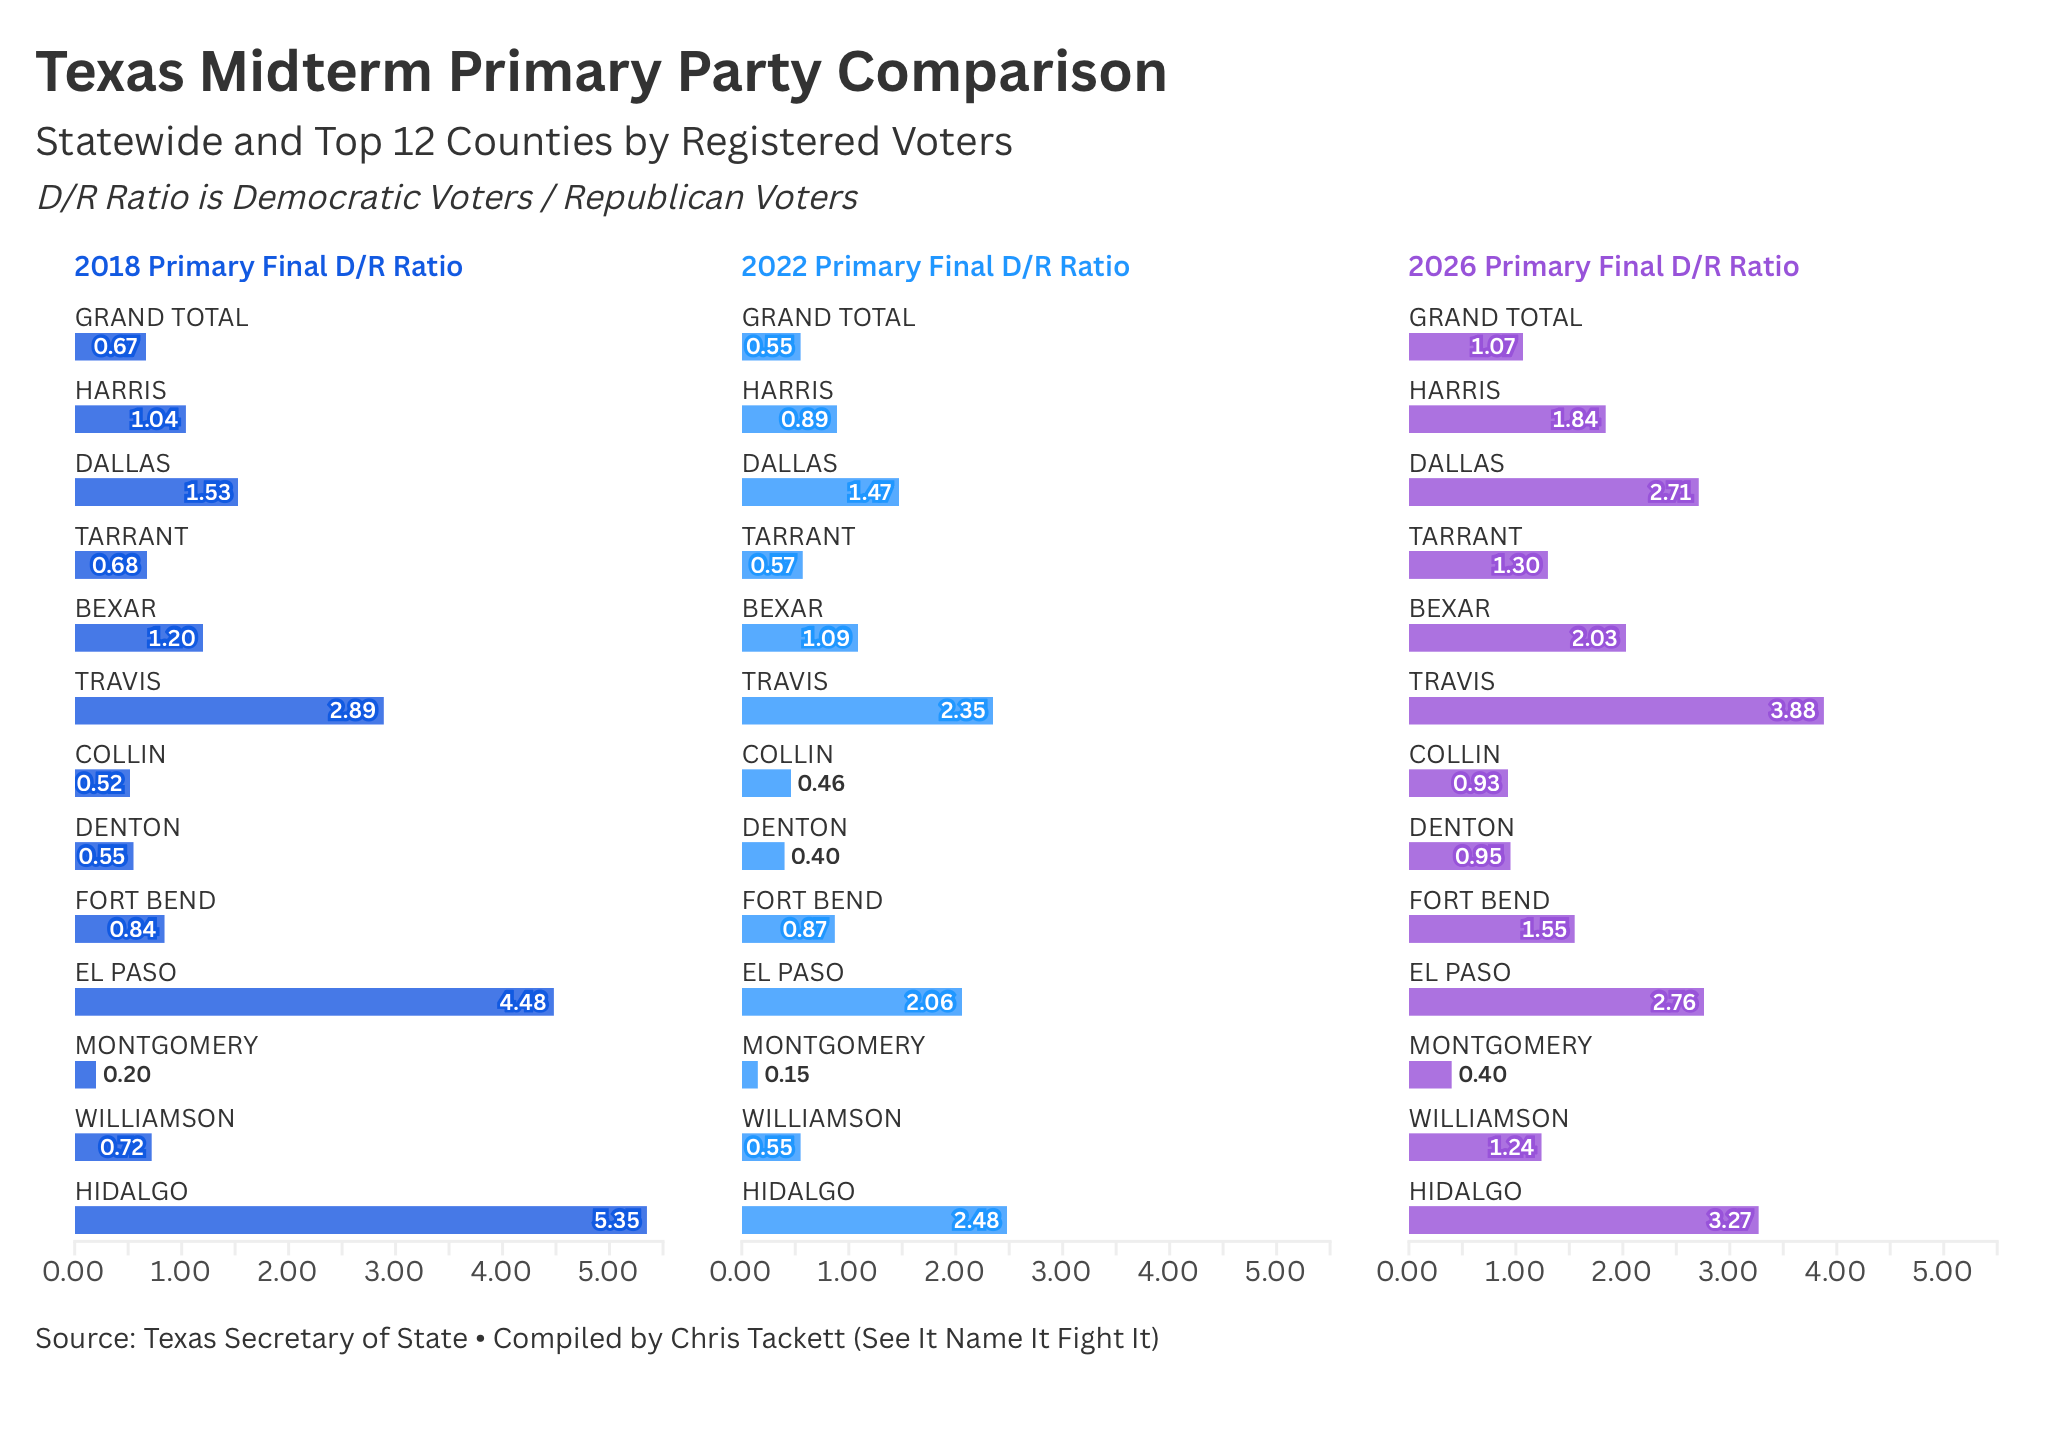
The county-by-county picture shows the breadth of it. Dallas went from 1.47 in 2022 to over 3.0. Harris from 0.89 to over 1.6. Tarrant from 0.57 to 1.3. Collin County, historically one of the reddest suburbs in Texas, reached near parity. Denton went from 0.40 to 0.80. Even Montgomery County, one of the reddest counties in the state, nearly doubled its ratio from 2022. Only 21 of the 254 counties have a lower ratio than they had in 2022. Only 55 of the 254 have a lower ratio than 2018. This is not a blue county phenomenon. It is a statewide structural shift. I’ve linked to all 254 counties with their 2018, 2022, and 2026 ratios here.
Let me pause on Hidalgo County, which for this piece will stand in for the other counties in the Rio Grande Valley (as they saw similar movement), and deserves its own call out. Since 2020, one of the most persistent counter-arguments to Democratic optimism in Texas has been the RGV. Republicans pointed to electoral gains there, and the data backed them up. Hidalgo's D/R ratio dropped from 5.35 in 2018 to 2.48 in 2022, a dramatic move that continued into 2024 and fed a narrative of durable Hispanic voter realignment toward Republicans. The 2026 primary data puts a significant dent in that narrative. Hidalgo came back to 3.27. It is not back to 2018 levels, and it would be wrong to pretend the Republican gains of the past several cycles didn't happen. But the direction has reversed, and in a county that was supposed to be a showcase for Republican inroads with Hispanic voters, that reversal matters.
What the Final Numbers Mean
Apply the midterm trendline to a D/R ratio of 1.07 and here is where the framework takes you.
Every 0.10 increase in the ratio has corresponded to roughly 5 to 7 points of narrowing in the November margin across four consecutive midterm cycles. The ratio moved from 0.58 in 2022 to 1.07 in 2026. That is a 0.49 point increase. Multiplied through the trendline, that implies a November shift of somewhere between 24 and 34 points from the 2022 result.
Greg Abbott won re-election in 2022 by 10.9 points. Apply the trendline. You can do the math.
Now, the honest caveats. Primary ratios are a leading indicator of November competitiveness, not a guarantee of outcomes. Candidate quality, fundraising, the national environment, and turnout infrastructure all matter between now and November. A competitive primary ratio is a necessary condition for a competitive November. It is not sufficient on its own.
Here is what the data will not let you dismiss. The enthusiasm gap that allowed Republicans to cruise to double-digit November margins in 2022 and 2024 is gone. The voters showing up for Democrats are not the 2008 Yellow Dog remnant who inflated the primary number and stayed home in November. They are younger. They are more female. They are more racially diverse. And nearly a third of them are new to primary voting entirely. That is a durable coalition being built in real time, not a statistical artifact.
The last time Democrats reached anything close to this level of primary enthusiasm in a midterm was 2018, when a ratio of 0.69 produced a race that came within 215,000 votes of sending Beto O’Rourke to the United States Senate.
The final 2026 ratio is 1.07.
The trend line from there runs through Texas Republicans.
One More Thing to Say
The data is historic. The coalition being built is real. And there is one thing that has to be said clearly before I close this out.
In 2008, Democrats ran up a primary ratio of 2.07 statewide. It meant nothing in November, for reasons I’ve already explained. The coalition that inflated that number was never going to show up for Barack Obama in the general. The primary enthusiasm and the November coalition were two different things, and the fracture was baked in before a single general election ballot was cast.
2026 is not 2008. The voters showing up now are not a dying coalition going through its last motions. The data on who they are, younger, more female, more diverse, newer to voting, tells a genuinely different story. But 2008 is still worth keeping in mind, because coalitions do not hold themselves together automatically.
The Democratic Senate primary that just concluded was a real contest. James Talarico won. Jasmine Crockett ran a serious campaign with a serious base of support. Those two candidates drew from different parts of the Democratic coalition, and the voters who showed up for Crockett did not all show up for the same reasons, or with the same priorities, as the voters who showed up for Talarico. That is not a crisis. Competitive primaries are healthy. But it’s a reminder that the coalition we just watched turn out in historic numbers is not a monolith, and it will not maintain itself on enthusiasm alone between now and November.
The work between March and November is coalition maintenance and focusing on a full ballot. It is making sure that every part of the Democratic primary electorate, the longtime base voters, the general-only voters showing up for the first time in a primary, the younger voters, the Crockett voters, the Talarico voters, feels seen and has a reason to show up again in November. The data says the ingredients are there. What we do with them is up to us. There are so many voters we still need to reach and activate.
The Bottom Line
The March signal has spoken. The trendline is historic. The coalition is real and it is growing. And the work starts now.
What are we going to do about it?
Lastly, Bo, this typical dumb leftist actually dug into the history to show that primaries do translate to generals.
See It. Name It. Fight It.
Brilliant analysis Chris. And terrific further commentary Sharon, et. al. Thank you!!!!!
PREACH!!!
One other factor, this unhinged, deranged, incompetent, petulant, clueless and uncaring administration will only continue to spiral out of control.
A November bloodbath awaits, one way or another.