


Everything You Ever Wanted to Know About Texas Public School Funding (But Were Afraid You Wouldn’t Understand), Part I: Understanding the Formula

I wrote this series back in 2019 but never did anything with it. It was an attempt to translate the things I had learned on the school board from 2014 - 2017, plus digging in to fight against the attacks on public education since. This may not be perfect, but it captures the core essence of how things work (at least how I understood it at the time). The Texas Legislature has met a few times since then, changing a few things, but the basics should be very similar. Posting it here to hopefully help others gain at least a little understanding. And remember, references are as of 2019, not current.
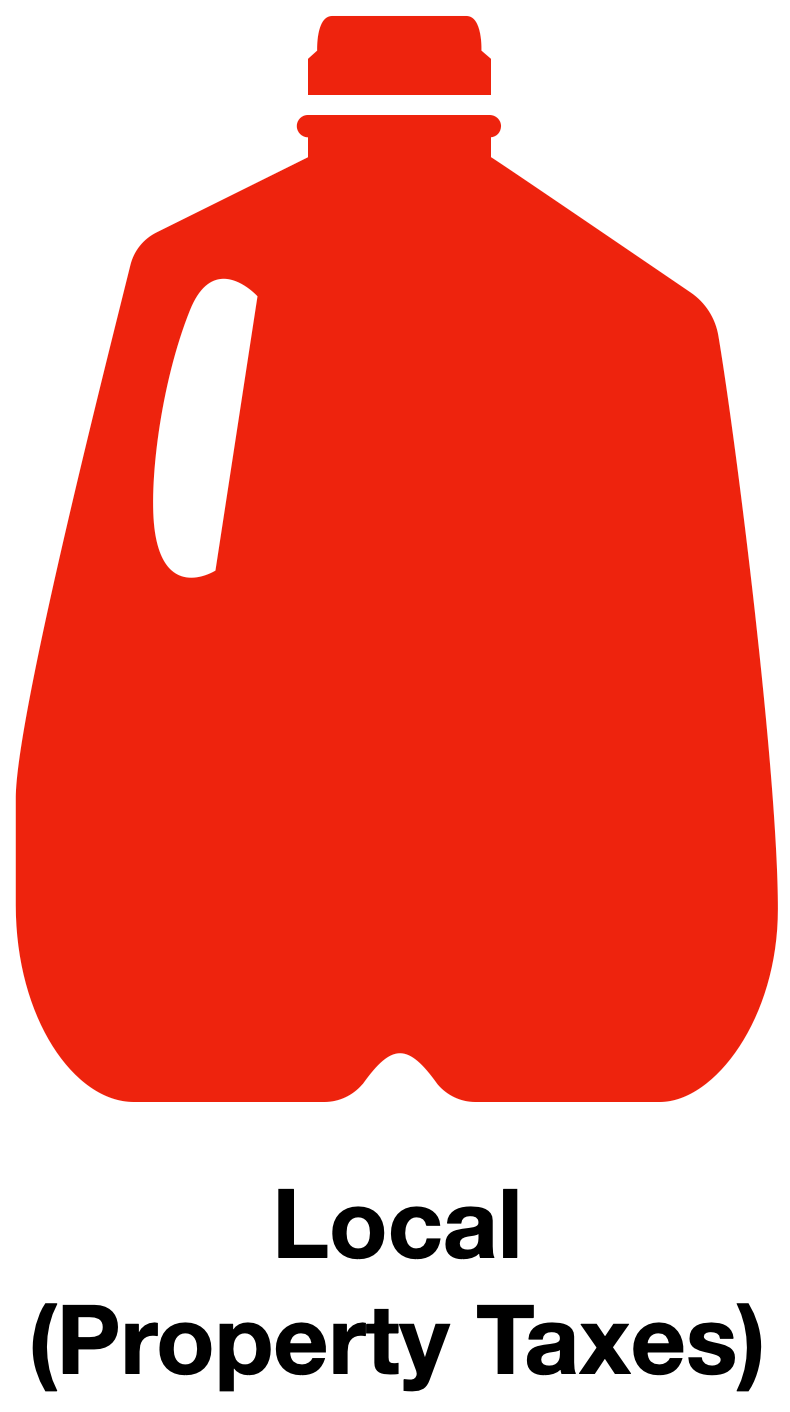
The 86th Session of the Texas Legislature is off and running. The Governor, Lieutenant Governor, and the Speaker of the House have all declared that public education is this session’s top priority. Another top priority for the lege is property taxes, which are inexorably linked to public education—public school taxes are the largest component of every homeowner’s property tax bill. The urgency of these two issues is no surprise; Texans care a lot about their schools, and they care a lot about how much they’re paying in taxes. Yolk those two issue together and you’ve got the sort of policy discussion that can send people over to the capitol grounds with protest signs and megaphones in hand.
But school funding and property taxes aren’t just controversial issues, they’re also complicated. Really complicated. Chances are that you’ve read plenty of stories about the lege’s attempts to solve the problem of school finance and stopped reading halfway through for one understandable reason: trying to navigate our labyrinthian school finance system is hard work, even if you have a good head for numbers. Hard work, but not impossible, if you take it one step at a time and have some friendly graphics to get you through the most difficult parts.
And that’s what we’re going to try to do here: lay out the basics of Texas school finance in a manner that will help you follow the debate as it unfolds over the course of the next few months in the lege. With this primer under your belt, you’ll be able to suss out which politicians and activists are feeding you a line and which are actually working on a solution.
Our three-part primer will focus on three major aspects of school funding. In this installment, Part I, we’ll explain the funding formula that determines how much money each school district gets. In Part II we’ll look at how the state decides what portion of each district’s funding comes from the district and what portion comes from the state. In Part III we’ll spell out the controversial program known as Robin Hood, which distributes money from affluent districts to less well-off districts. And then we’ll sum up how everything fits together and what pressures are being brought to bear on the current lege.
Let’s Get Started
To understand why there is such an intense focus on public school funding, let’s get some stats on the table. According to the National Education Agency, last year Texas put $60 billion into public education. That’s a lot of money, but we’re a big state with a lot of students. When you crunch the numbers, Texas ranked 40th in the country in funding per student, $10,952 per student. For perspective, the national average funding per student was $12,998 in 2017— about $2,000 more than we collect. There are 5,343,893 students in the Texas public school system, which means that if Texas wants to be at least average in school funding, we would have to raise almost $11 billion per year to close the gap. Even by the elephantine standards of state budgeting that’s a daunting number. And never forget, every district is different, so filling up a glass with funding requires you knowing how big or small the glass needs to be.

What are the big pieces of public school funding? Let’s start off with two minor pieces of the puzzle that we’re going to dispense with pretty quickly so we can focus on the most important (and complicated) stuff.
The first is federal funding, which provided 10% of the 2017 $60 billion budget—$6 billion dollars. All of those Federal dollars are tied to specific grants and programs, such as free and reduced lunches for economically disadvantaged students. Those funds aren’t part of the Texas public school funding formula; they’re not what everyone is fighting over. So we’re not going to say anything more about them.

The second piece of the puzzle is interest & sinking (I&S) taxes, which make up 16% of local property taxes funding schools in Texas. I&S taxes are used to repay the debt on any kind of capital expense or improvement, such as a new school, athletic facilities, renovating existing campuses, etc. Any bond packages that come before a community are paid for with increases in the I&S property tax rate, which is voted on and approved by those in the community. On a statewide basis, the 2017 I&S Tax Rate averaged 0.211 per $100 property valuation, though there’s great variation from place to place. There were 173 school districts in 2017 that had a zero I&S rate. In Eanes ISD, which passed a $54 million bond in 2011 and a $52.5 million bond in 2015 to update campuses, they have an I&S rate of $0.14. By contrast, McKinney ISD, which in 2016 approved a bond package totaling $220 million, including $50.3 million for a football stadium and events center, has an I&S rate of $0.45. A half million dollar house in Eanes ISD would cost its owner $700 in I&S taxes; the same price house in McKinney ISD would cost its owner $2,250 per year.
Dollars collected as part of the I&S tax rate can only be used for debt service on bonds issued. If a community votes to build a football stadium, the school system can’t divert those dollars to give teachers a raise. Things like high-ticket football stadiums do get brought up as part of the conversation about “wasteful schools,” but the community agreed take on that tax burden. It’s not something the state has any control over, other than limiting the maximum I&S rate to $0.50. If you’re unhappy about the bonds your locality has passed in recent years, you may want to get involved in local politics. But the lege and the governor don’t have any say in that. So again, we’re not going to talk any more about it.
The Nitty Gritty
Which brings us to the real nitty gritty, the place where it’s easy to get lost in the brambles, though we’re going to do our best to keep things as clear as possible. Here we go.
Article 7, Section 1 of the Texas constitution states “it shall be the duty of the Legislature of the State to establish and make suitable provision for the support and maintenance of an efficient system of public free schools.” Free public schools have been important to Texas for a very long time. Even before our current constitution, looking as far back as 1845, the original state constitution called for one-tenth of the annual state tax revenue be set aside as a fund to support free public schools. As Texas has grown, how we fund schools has been contentious and has changed a lot over the years, coming a long way from that original one-tenth target.
Today, local taxpayers and the state share the burden of school funding via a formula that has seen the State’s input steadily decrease over the past decade. In 2008 the state provided nearly 45% of the total funding for schools, mostly drawn from the State’s General Revenue Fund. In 2018 that number had dropped to 35%. That left locals to cover well over 50% (the feds, as mentioned before, cover the other 10%). This shift, from the state to local level, is one of the main flashpoints in the debate over school funding.
Our school taxes have two components, interest & sinking (I&S), which we’ve already discussed, and maintenance & operations (M&O).
Think of M&O taxes like your home checking account, from which you pay your month to month bills. M&O taxes pay for the things that make a school run: teacher and staff salaries, utilities, furniture, food. By state law, a locality’s M&O property tax (and remember that schools taxes are just a part of your overall property tax bill, with city, county, and any special taxing districts making up the remainder) is calculated per $100 property valuation and cannot be more than $1.17. But getting even that high isn’t easy; a locality that wants to raise its rate any higher than $1.04 must hold a local referendum in order to do so. Conversely, a locality can’t let its rate fall too low; if a district wants to continue receiving funds from the state, it must maintain a minimum rate no lower than its 2005 rate, which for most districts would be $1. (We’ll get to the importance of 2005 in a minute.)
As it turns out, Texans are fairly parsimonious about these taxes; on a statewide basis, the 2017 M&O Tax Rate averaged $1.087 per $100 property.

To determine how much a school district needs to educate students, a formula was created in the Texas Education Code, which undergoes minor and major adjustments every legislative session. It’s the choices made in creating and adjusting this formula that have caused the state’s share of funding to decline and ticked off many Texans. This is the really important stuff, so pay close attention.
Allotments, Adjustments, Modifications, and Other Fun Things
The biggest component of Texas’s funding formula for the maintenance and operation of public schools is something called Tier 1, which makes up around 95% of the M&O funding. (There’s also a Tier Two, but it’s a minor player in this drama.) This part of the formula is where the state determines how many dollars a district needs. That determination is based on three factors: the number of kids in the school, the needs of the kids, and any special circumstances. Because every district has a different mix of kids with different needs, some districts get more money per student than others.
The State has determined that the starting point for funding on a per student basis is $5,140 (2024 Chris noting this was raised to $6,160 in 2019 and hasn’t moved since). So if a school with, say, 1,000 students receives that base rate, it would receive $5,140,000 in M&O funding for the year. But every district has kids that change the rate, as there are a host of modifiers that affect the final number. The first adjustment is multiplying the $5,140 base rate by a school district’s “Compressed M&O Rate,” which is 2/3 of a district’s 2005 M&O tax rate. You’re probably thinking, “What does that have to do with anything?” and “Why am I hearing about 2005 again?” (We told you we’d get to this.) Here’s the explanation: In 2005, the Texas legislature decided that property taxes, which averaged $1.50, were too high in much of the state, so it changed the maximum tax rates and required all school districts to cut their M&O tax rates, by 2/3. This compressed rate became the new reference point in the formula.
This isn’t the only adjustment. Next comes the Cost Of Education Index, which was established in 1991 (and has not changed since). The COE multiplies the allotment by a factor of 1.02 – 1.20 to address the additional costs to provide salaries and benefits in certain areas of the state where you may have to pay more to be competitive with larger markets. There are also adjustments based on whether a district is small or mid-sized, to assist with the costs that in larger districts may be offset by economies of scale. (For instance, a school with 3,000 students and a school with 800 students both need an auditorium, but the school with 800 students has less tax money to draw on to maintain the facility.)

Once a district’s adjusted allotment has been set, the state has to consider that district’s mix of students. There are three types of students that will be weighted differently, which means they are funded differently:
Regular Program - The largest grouping of students are those who have no special needs. They earn the base level of adjusted allotment for a district.
Special Education - Students in special education programs have different needs than regular program students, and therefore require very different levels of support. To reflect this, each special ed student in a district is “weighted” and then converted into an equivalent number of regular program students. For example, a regular program student is counted as 1, students in speech therapy count as 1.1, students in a self-contained classroom on campus and have severe special needs count as 5.
Career & Technology / Advanced CTE - Due to the costs of career & technical education, such as equipment for an engineering lab, a kitchen for culinary arts, or tools for an automotive shop, a district is provided additional dollars based on the number of students in those programs

Once the three elements have been totaled, all students in a district are represented. But that isn’t where the allotment for funding finishes. Seven more modifiers are then applied to reach the final funding target, ensuring the district has the funding to meet the needs of its student population. The modifiers are:
The number of Gifted & Talented students
The number of Compensatory Education students (an example
would be economically disadvantaged students)
The number of Bilingual Education students
Public Education Grants (for students attending school outside a
home district)
New Instructional Facilities (only available to a very small
percentage of property poor districts that can’t raise enough I&S
taxes to support its needs)
Transportation needs
The number of high school students
All of these modifiers can add dollars to the allotment, so that a district ends up with a glass that could look something like the graphic below.

Because of all these factors, comparing the funding per student on a district to district basis doesn’t work. Two different districts may have roughly the same number of students, but one with a large population of ESL students and special education students would likely have a very different funding allocation than a district with few ESL or special education students.
Are there other components in school funding that we could get lost in? Yes, there’s Tier II, “Golden Pennies,” “Copper Pennies,” and how tax rates move up and down. But remember that Tier I funding makes up around 95% of all M&O funding. If you understand Tier I, you have a firm grasp on what goes into the vast majority of the funding formula. Unless you’re a state legislator or a school board member, you probably don’t need to know about the other five percent.
What you do need to know about is how your district actually gets the money to meet the needs that have been determined by the state’s formula. And that’s where things get really interesting—and contentious, as we’ll see in the next installment, where you figure out how much the state kicks in to public schools.

If you are ready to jump into Part II, you can via this link!