
Bubbles Since 2000
Getting back on the horse

Election sucked. And pretty much played out in Texas as expected. For something different to happen, turnout had to surge. It did the opposite. And people kept chasing the R voters who just needed that right issue and then they’d flip D, but nobody ever quite found that issue, or maybe those R voters were just looking for any old excuse to keep voting R.
STOP CHASING REPUBLICANS IF YOU WANT TO WIN.
OK, let’s look at bubbles. I’ve captured all 254 counties Presidential outcomes since 2000, looking at their % voting for the R at the top of the ticket (X axis) against the county’s election turnout (Y axis), sizing the bubbles by the number of non-voters (HINT: GO AFTER THE BIG BUBBLES). I’ve also color coded things into four groups, based on the ranking on number of registered voters in a county, with 1 to 10, 11 to 25, 26 to 50, and 51 to 254.
I see patterns. Which I guess is better than seeing dead people.
2000
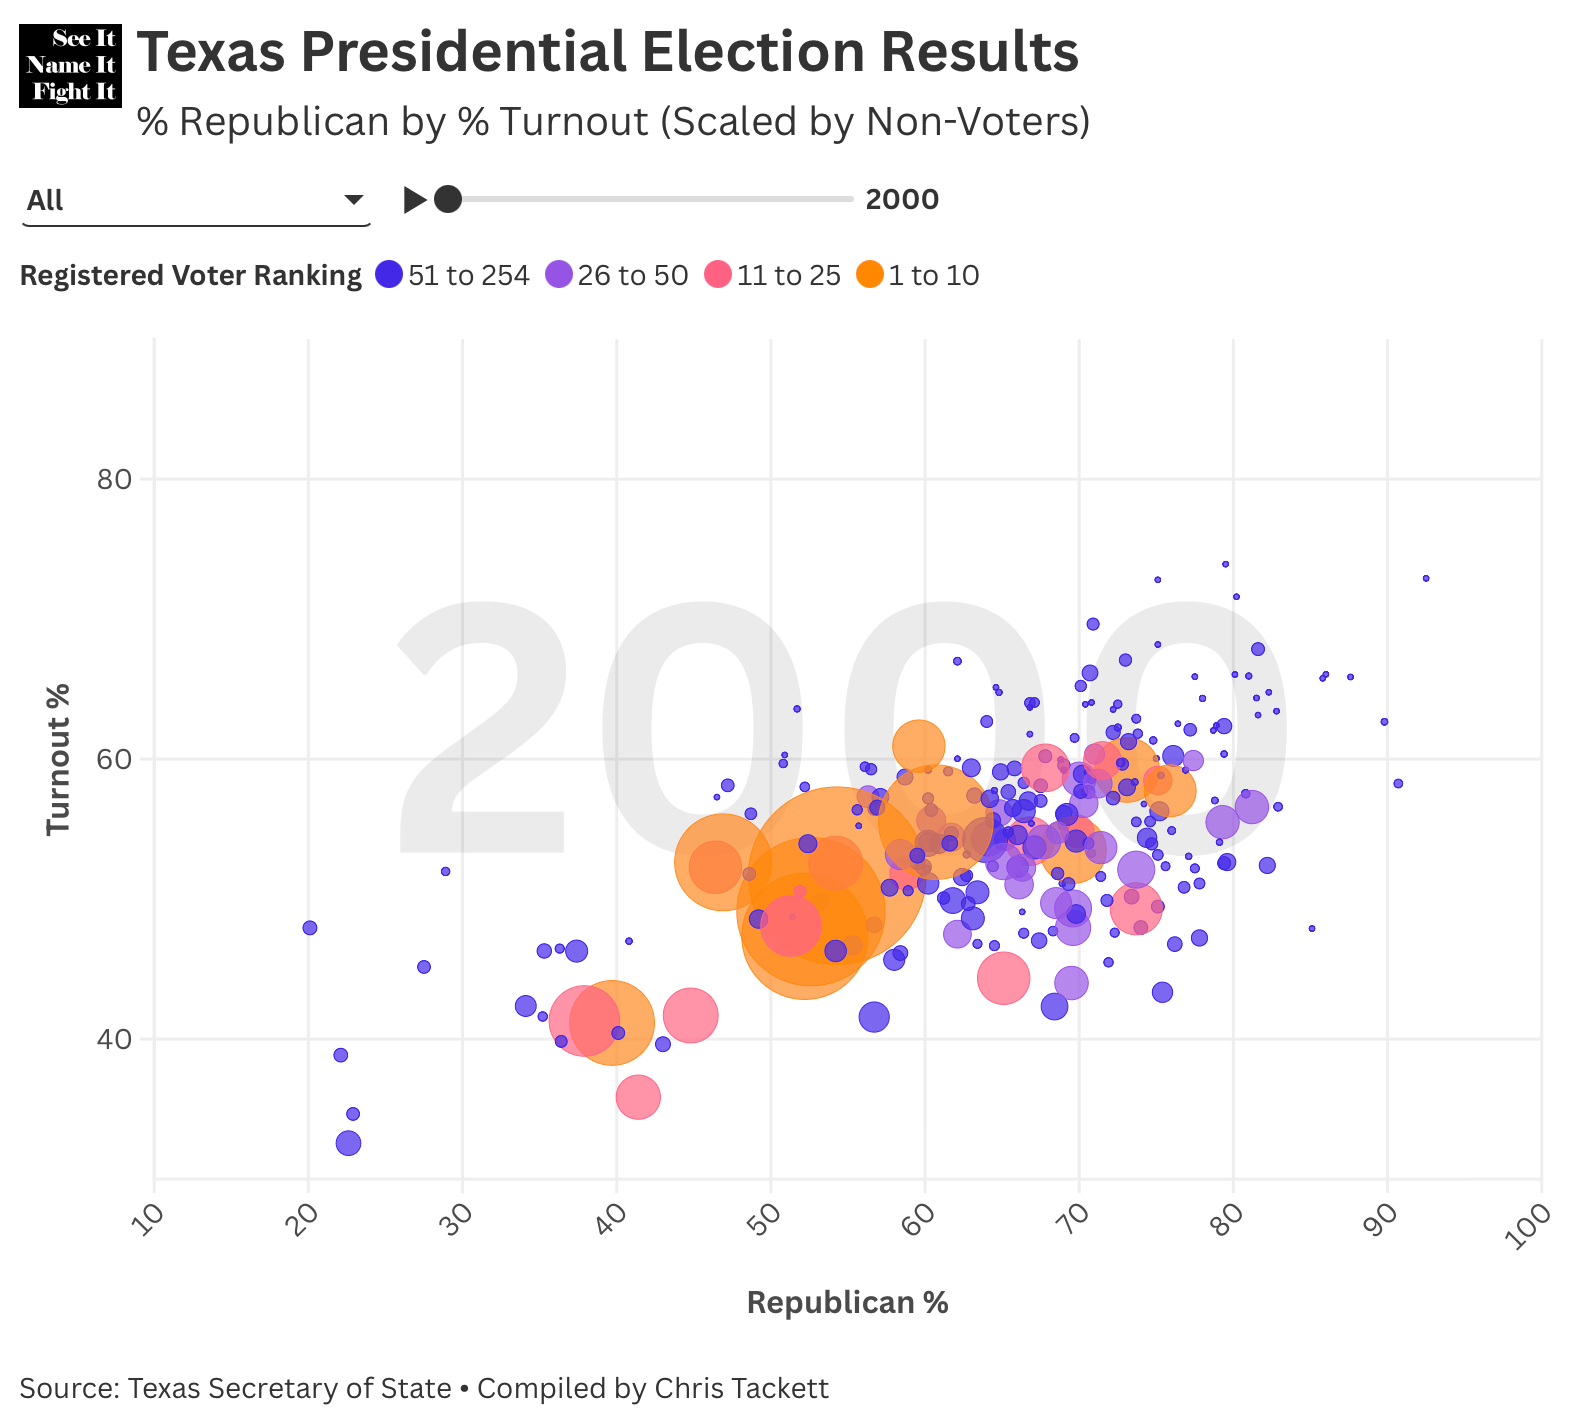
In 2000, counties were massed together with largely similar outcomes.
Statewide turnout: 52%
Overall Republican vote percentage of 59.3%.
1 to 10: 55.8% Republican
11 to 25: 57.7% Republican
26 to 50: 68.7% Republican
51 to 254: 64.6% Republican
2004
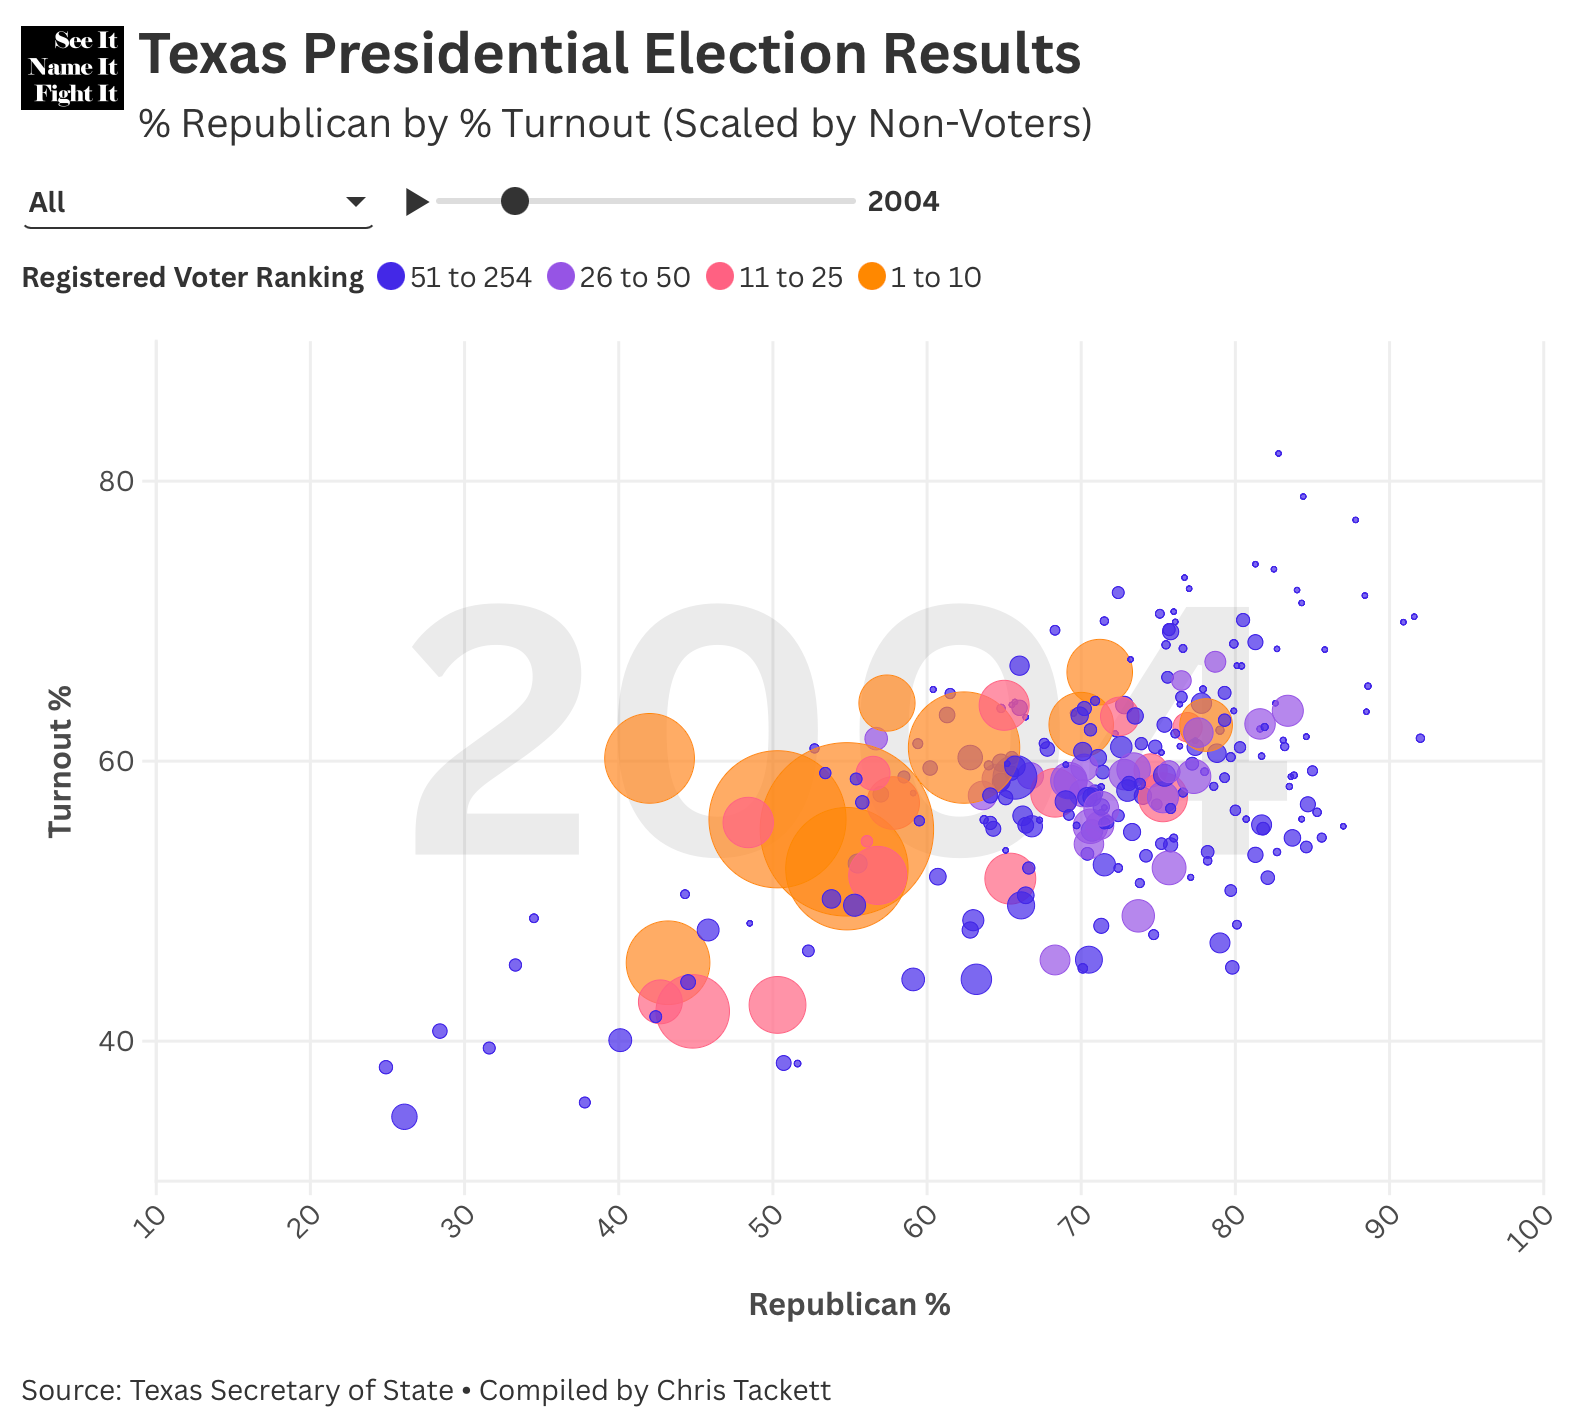
In 2004, as turnout ticks up, some of the big orange counties start moving left. The purple counties shift to the right.
Statewide turnout: 57% (+5.0%)
Overall Republican vote percentage of 61.1% (+2.8%)
1 to 10: 56.1% Republican (+0.3%)
11 to 25: 60.5% Republican (+2.8%)
26 to 50: 72.6% Republican (+3.9%)
51 to 254: 69.0% Republican (+4.4%)
2008
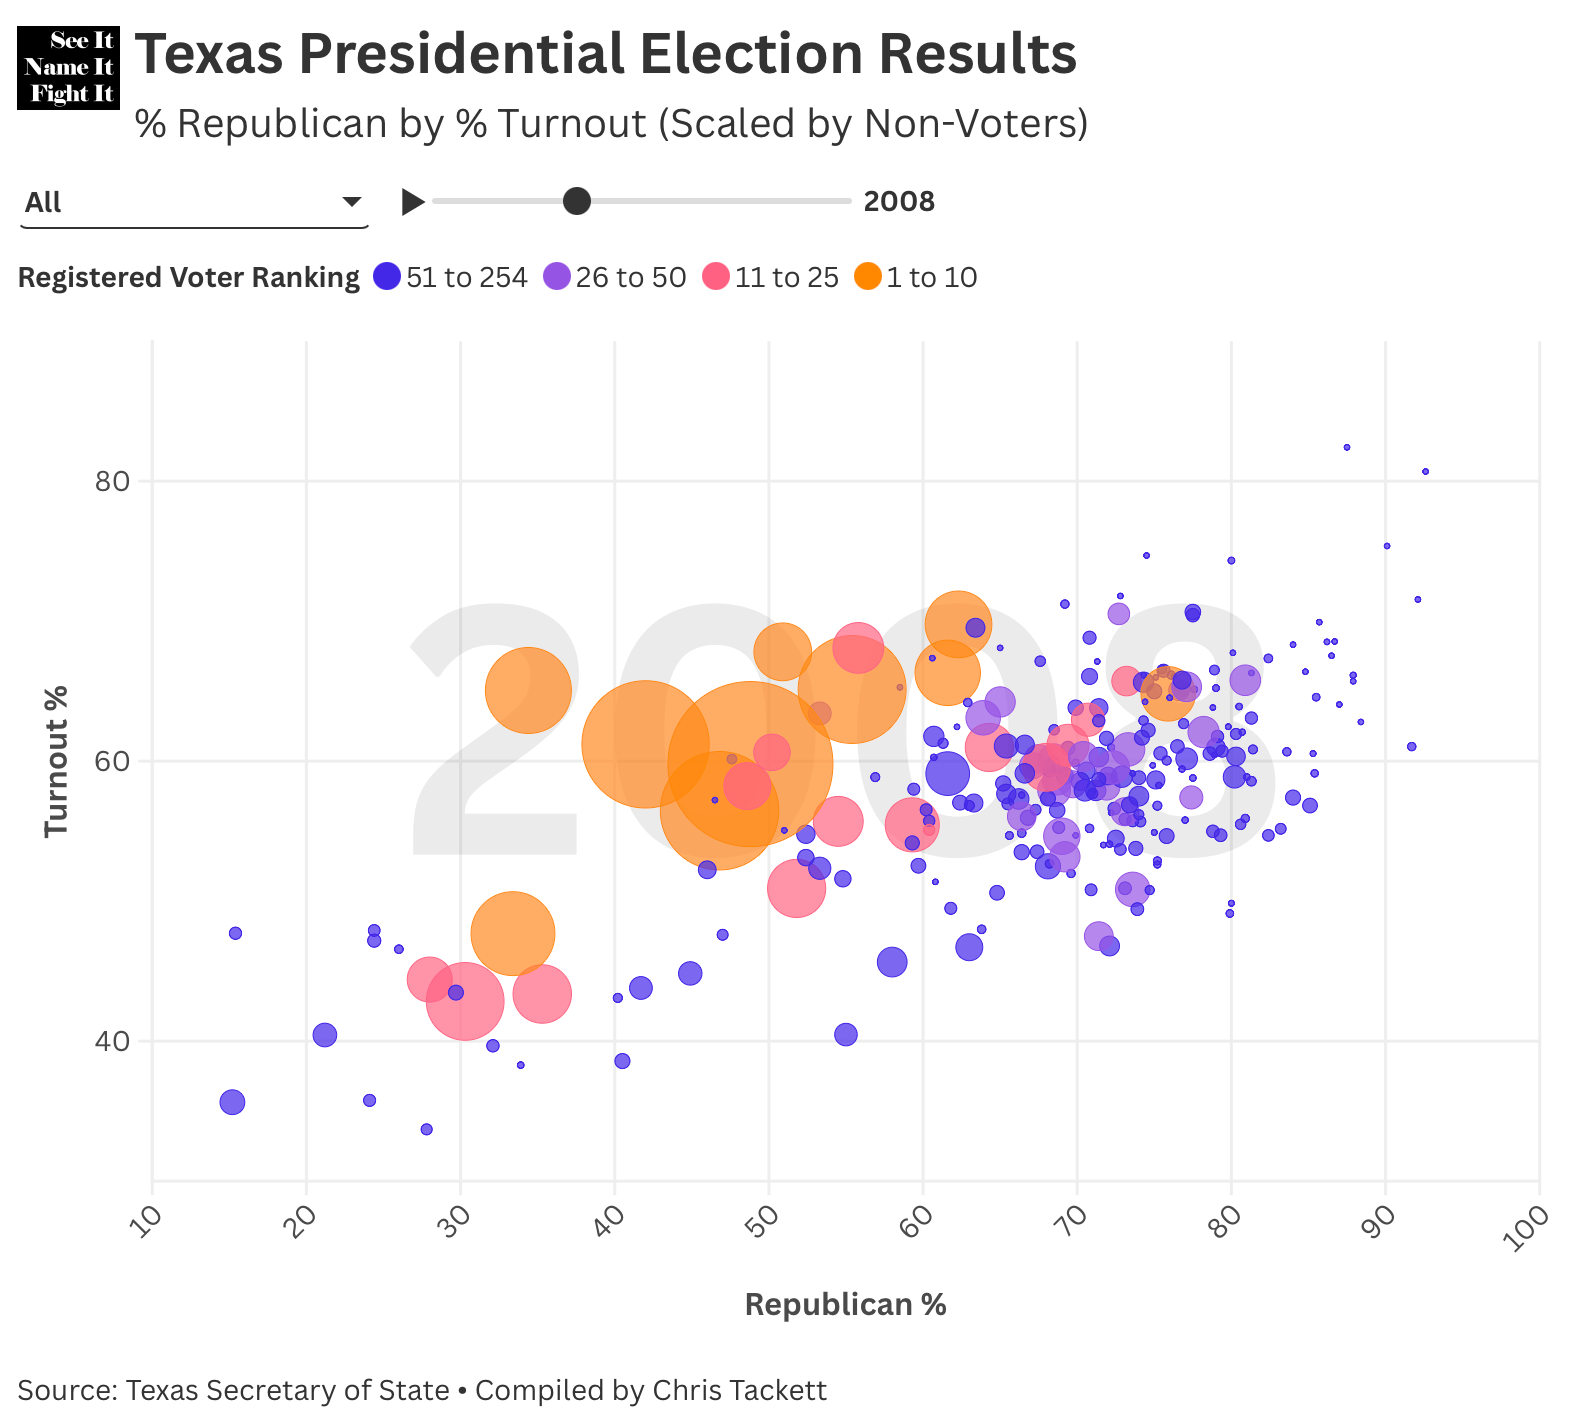
In 2008, turnout continues to increase, and the state gets a lot more blue, with bigger counties pushing left. Even the small counties see a very small shift left (from a very right spot).
Statewide turnout: 60% (+3.0%)
Overall Republican vote percentage of 55.5% (-5.6%)
1 to 10: 49.1% Republican (-7.0%)
11 to 25: 53.8% Republican (-7.7%)
26 to 50: 70.8% Republican (-1.4%)
51 to 254: 67.8% Republican (-1.2%)
2012
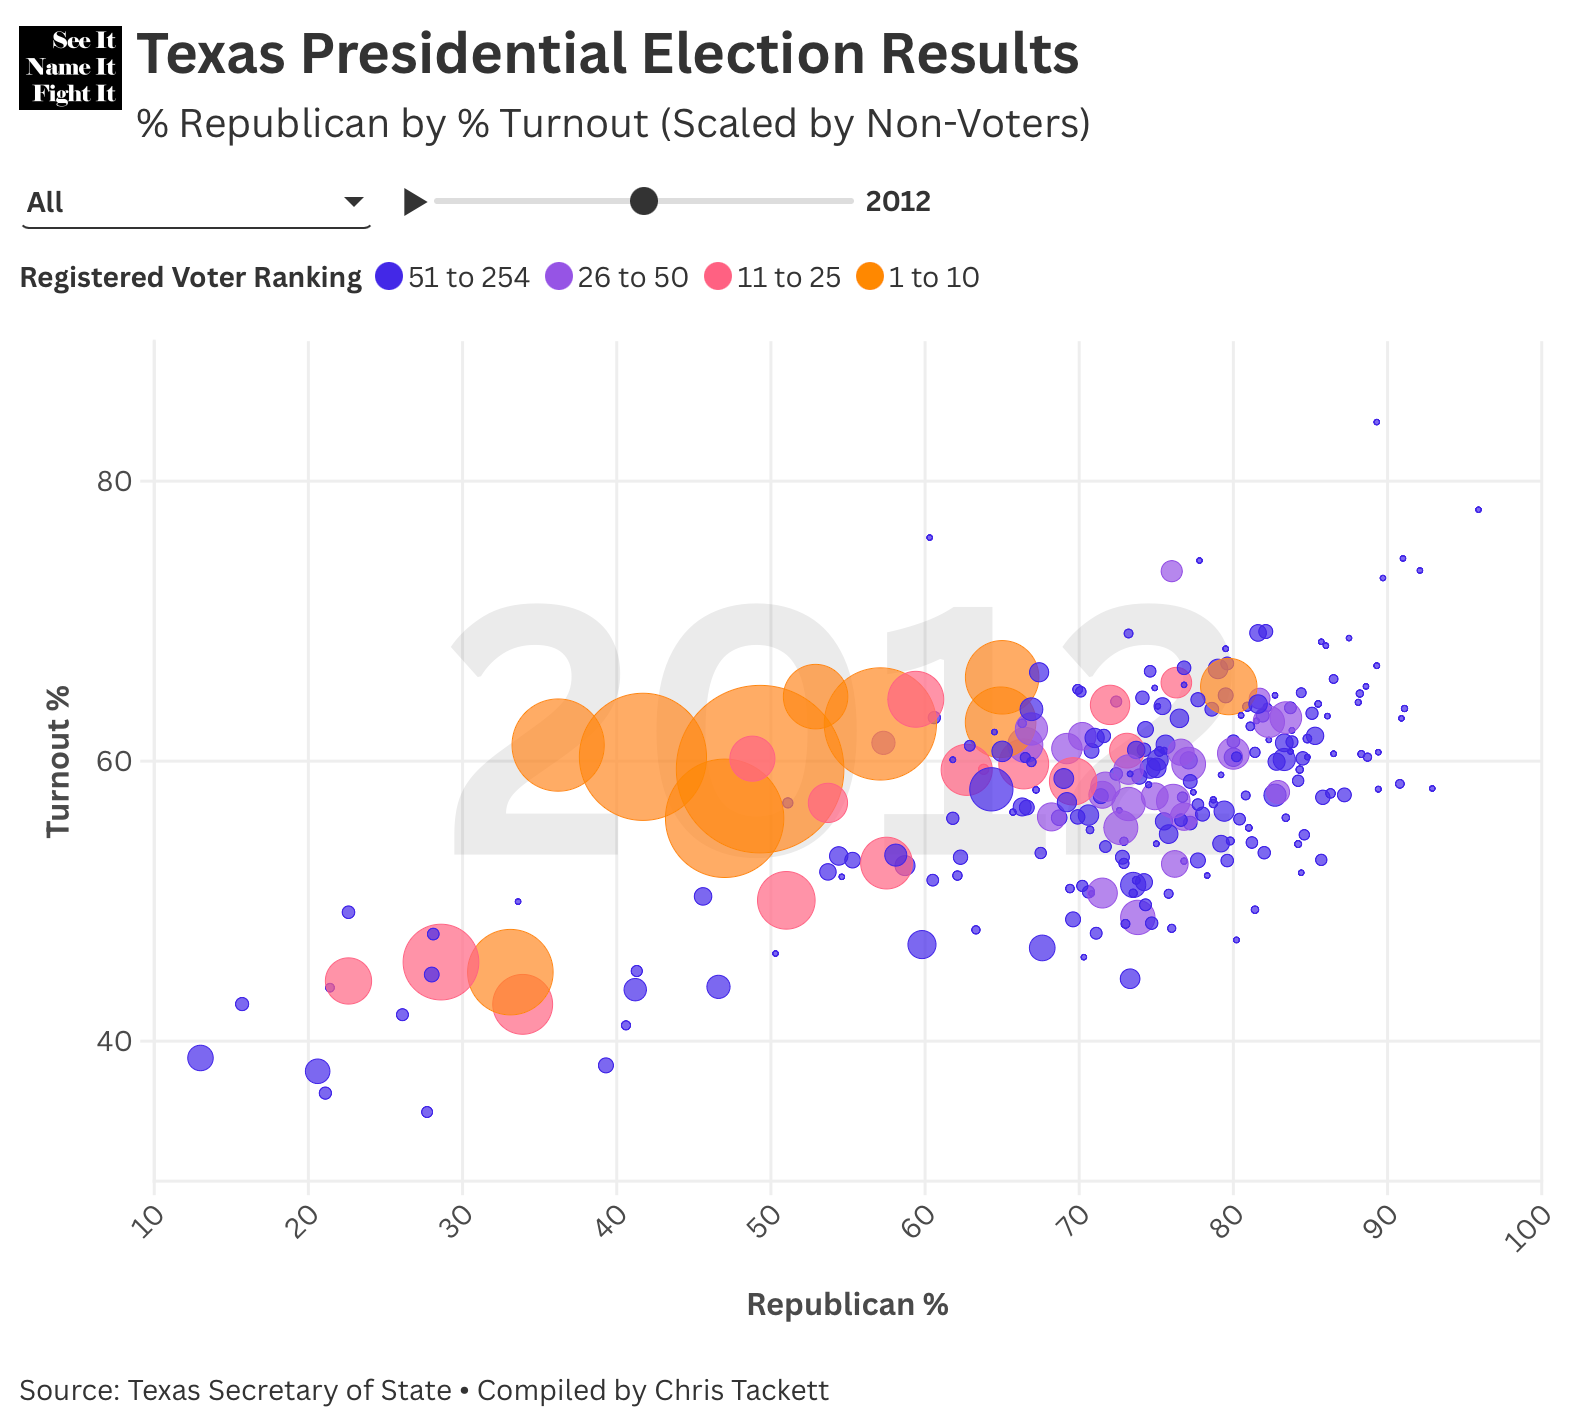
In 2012, turnout dips by a point, and everything moves right. The big counties move a little, but from 50 to 254, they push right a lot.
Statewide turnout: 59% (-1.0%)
Overall Republican vote percentage of 57.2% (+1.8%)
1 to 10: 50.4% Republican (+1.3%)
11 to 25: 54.9% Republican (+1.1%)
26 to 50: 74.0% Republican (+3.2%)
51 to 254: 71.0% Republican (+3.2%)
2016
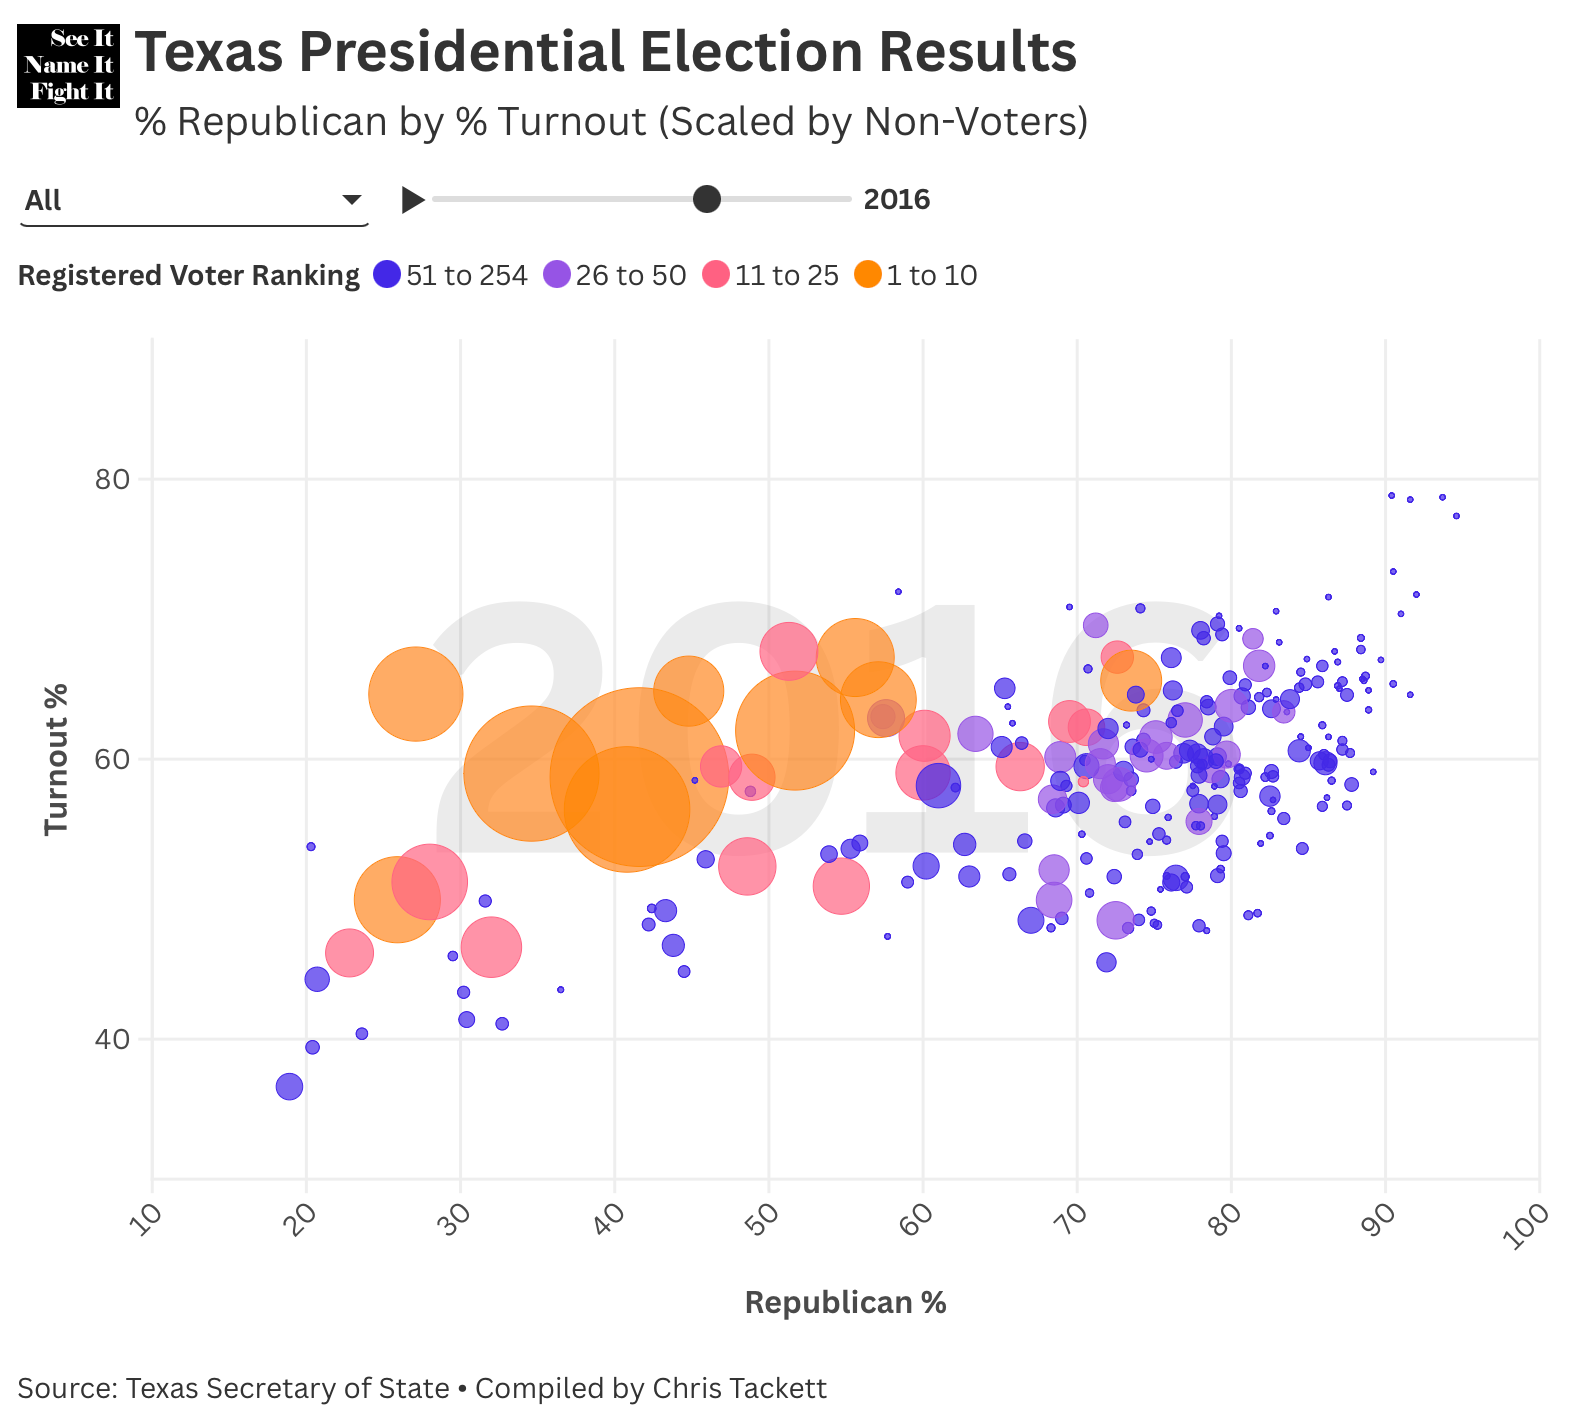
In 2016, turnout stays the same, but the state again moves left. Big counties see the same kind of push as 2008. Medium counties go left as well, just not as much. The 204 smallest counties in the state? They push right
Statewide turnout: 59% (No change from 2012)
Overall Republican vote percentage of 52.2% (-5.0%)
1 to 10: 43.1% Republican (-7.3%)
11 to 25: 51.2% Republican (-3.7%)
26 to 50: 72.4% Republican (-1.6%)
51 to 254: 72.4% Republican (+1.4%)
2020
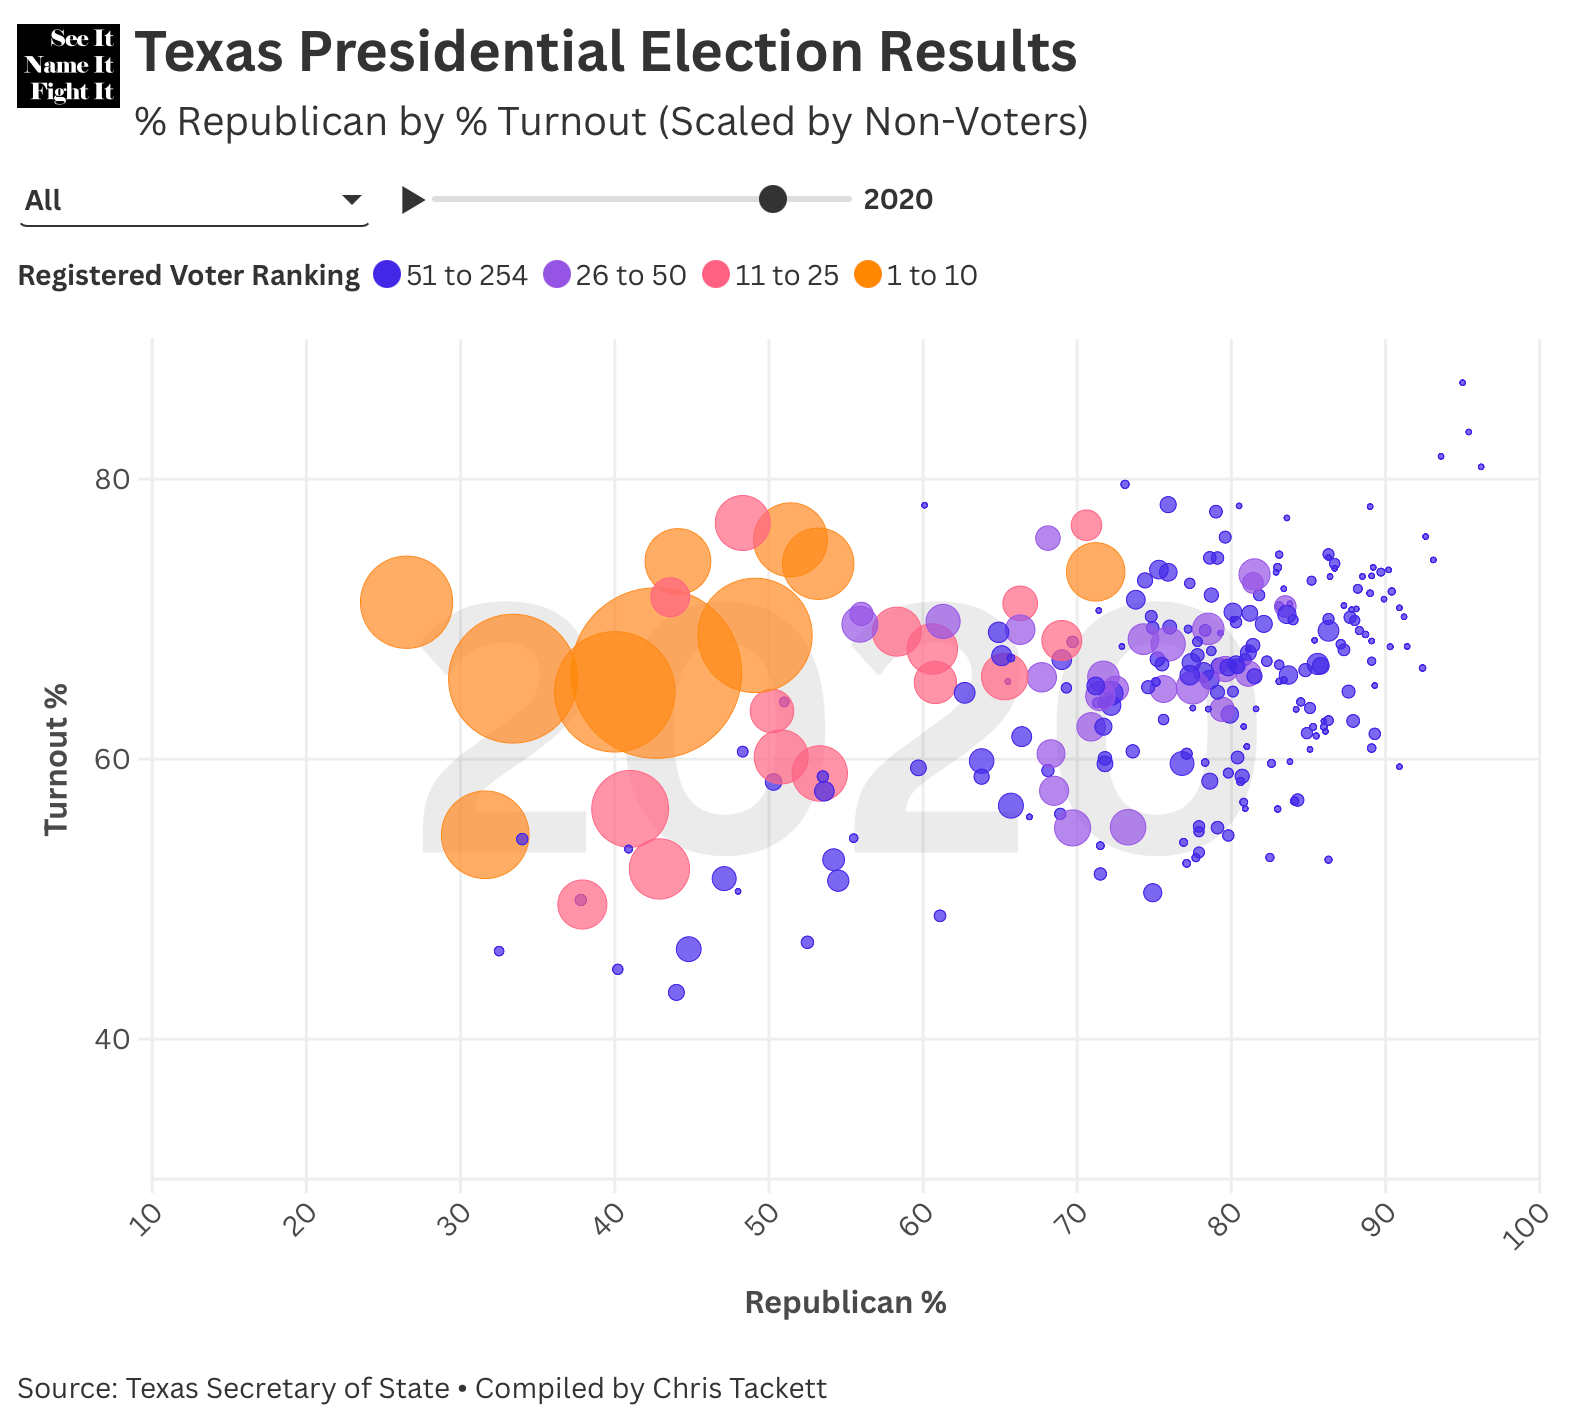
In 2020, turnout jumps 8 points. Big counties continue to ease to the left. The smallest 204 continue their trend further right.
Statewide turnout: 67% (+8.0)
Overall Republican vote percentage of 52.1% (-0.1%)
1 to 10: 42.5% Republican (-0.6%)
11 to 25: 53.4% Republican (+2.2%)
26 to 50: 71.7% Republican (-0.7%)
51 to 254: 75.2% Republican (+2.8%)
2024
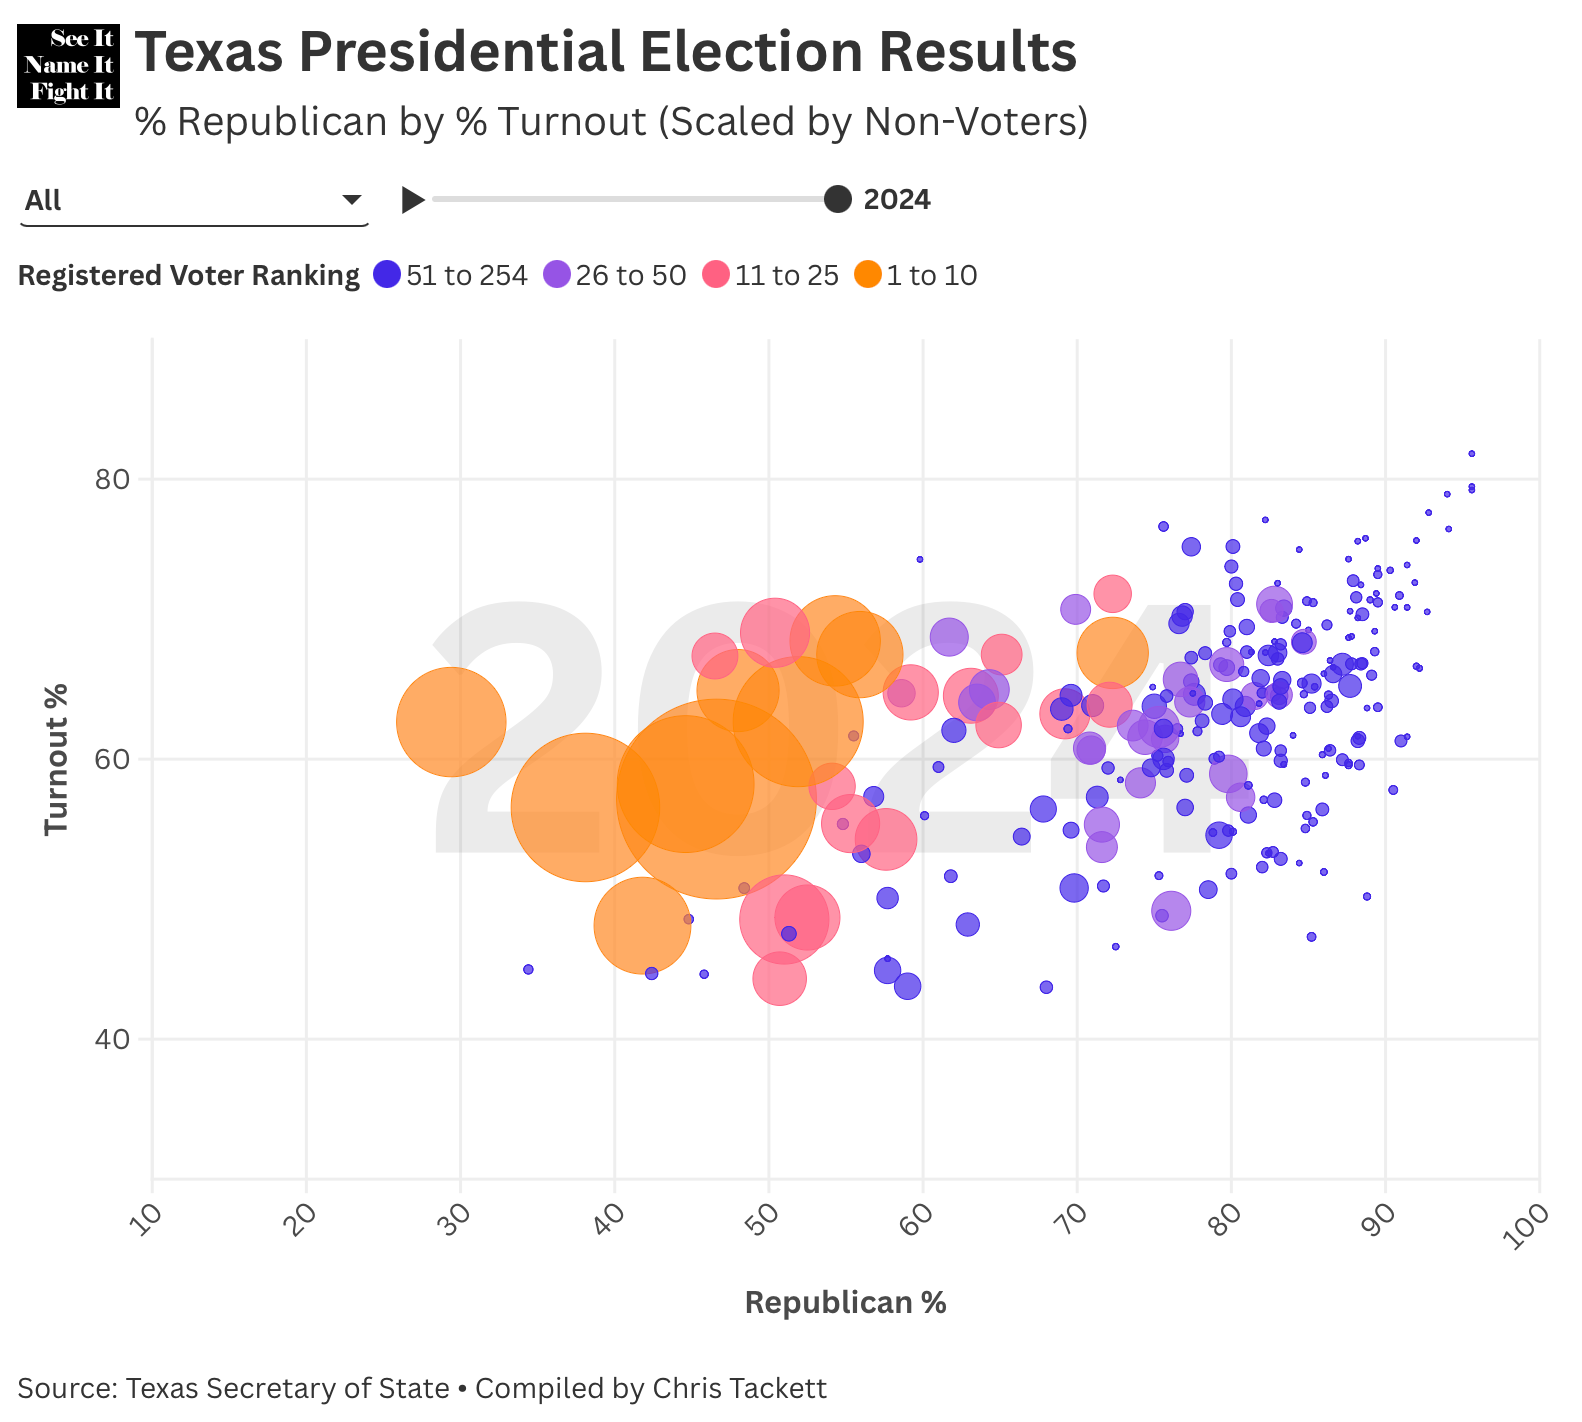
In 2024, turnout returns to the 2016 level and the state slides back to the right. All counties see a tick right, with the biggest hit in the biggest counties, where turnout matters the most.
Statewide turnout: 59% (-8.0%)
Overall Republican vote percentage of 56.1% (+4.0%)
1 to 10: 46.6% Republican (+4.1%)
11 to 25: 57.8% Republican (+4.4%)
26 to 50: 73.7% Republican (+2.0%)
51 to 254: 78.1% Republican (+2.9%)
Good god, look at the size of the orange circles in 2024.
Republicans don’t want people to vote, because they know when more people vote, that means young, urban, diverse voters are casting a ballot. And young, urban, diverse voters don’t really align with the BS the Republican Party is doling out these days.
So start working NOW. Get MORE progressive, not less. Connect in your community and talk about how we can make someone’s life better, not who to be scared of.
And, if you want to see these bubble charts animate, or to zero in on just one county or another, CLICK ME! The patterns are really easy to see when you can toggle back and forth between years. And yeah, I toggled a lot getting this ready to roll.
See It. Name It. Fight It.
Thanks Chris. Excellent breakdown.
If Trump 2.0 breaks like it’s shaping up in the prelude, then voter turnout in ‘26 may take care of itself. Still, much work to do.