

Following The Trends

Trends are interesting things. They can show you where we’ve been, and based on that, where we are likely to head. You can be so focused on where we’ve been that you miss something significant about what is happening now, which completely disrupts where we are headed, throwing the trend completely out of whack. You can also zero in on one take on a trend, but miss the mark on what really drives the outcome, where the trend is really coming from, setting expectations too high or too low.
Political outcomes feed trends. Political outcomes don’t generally happen by accident, and are driven by the hard work of candidates, volunteers, parties, and yes, things like changing demographics and attitudes. Presidential races every four years give us a solid cadence and turnout model to look at, from the top of a ticket, down into State level races. With democracy seemingly at risk, understanding the trends, using them to help decide where we should focus our attention and our limited resources, feels important.
To help me understand what is happening in Texas, I dove into the numbers from the Texas Legislative Council’s datasets from the 2012, 2016, and 2020 General Election outcomes at a precinct level, top of the ticket numbers as well as each individual Texas House race outcome, utilized the re-districting outcomes at a precinct level to revisit each of those elections using today’s districts, and trended out where we “could” land in 2024.
The first place you might look for a trend is as simple as the 2022 elections, to see who got elected to the Texas House, looking for who had a close election and invest there. What that analysis misses is a key variable: turnout. Presidential elections see a lot more people showing up to vote, with a heavy dose of casual voters casting a ballot. That means using 2022 for a trend doesn’t feed an accurate trend. That’s why I’m only using 2012, 2016, and 2020. Why not earlier Presidential elections? The TLC doesn’t go back to 2008, but three gives us enough to trend, and it does keep us “current”.
When talking about a statewide election (say Colin Alred v Ted Cruz for US Senate), looking at districts on a top of the ticket level should give fairly accurate picture of the trend. Individual districts will be Party + based on how they voted in the last election. For example, saying a district is R+8 means they got 8 percentage points more votes, ie. 54 to 46. Investing in a district that is R+40 and in 2016 was R+30 might make less sense than one that is D+2 and in 2016 was R+4, as you can see momentum that you might want to capitalize on. Does this same method apply when looking at Texas House races? You can do it, but it doesn’t feel accurate.
Here’s why: traditionally there are quite a few voters who show up and only vote for the top of the ticket. That’s the only one they know, so that’s the only box they check. That means undervotes for the down ballot races, which can change the dynamics. ALSO, in 2016 and 2020 you had a candidate on the ballot for Republicans that actually saw the inverse occur, where the House candidate actually drew more Republican votes than the top of ticket, meaning people were either skipping the Presidential race, voting 3rd party, or voting for the Democrat, and then returning to their normal voting pattern, voting Republican down the rest of the ticket.
So if you are doing analysis of Texas House races and aren’t trending from House race outcomes (rather than top of ticket), you are likely off base in most races. What makes this a little more complex is the fact that you don’t have opponents in every House race, making some years unreliable. As I’ve done my trending, when there is a district that had 10% or more zero vote precincts, I’ve substituted the top of ticket for the empty slot. I know, not optimal, but it at least gives us something to work with.
Now that we have a method and a model, that’s enough explanation. Let’s get to some House races, as they will dictate if we end up with vouchers (and other bad things) in Texas next legislative session. And don’t forget, a trend is just a possible outcome if things continue in the same direction. They can be derailed, so don’t head to Vegas on any of this.
Here we go!
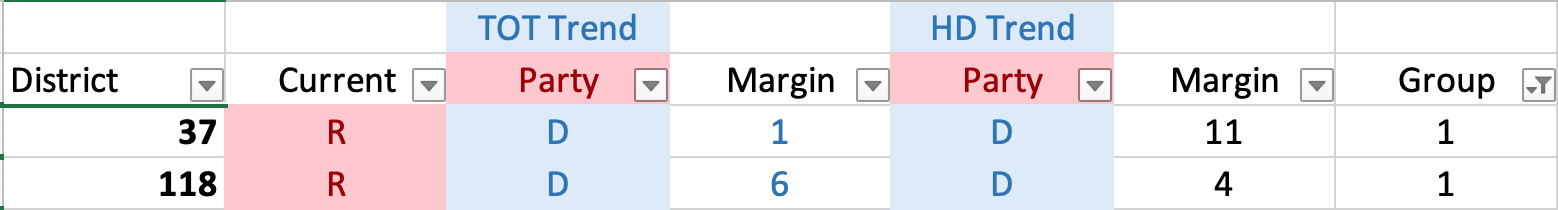
There are three races that are currently Republican that show both a top of ticket trend and House district trend that ends up with Democrats in the seats:
HD 37
HD118
These are my Group 1 races, a place to invest a lot of attention.
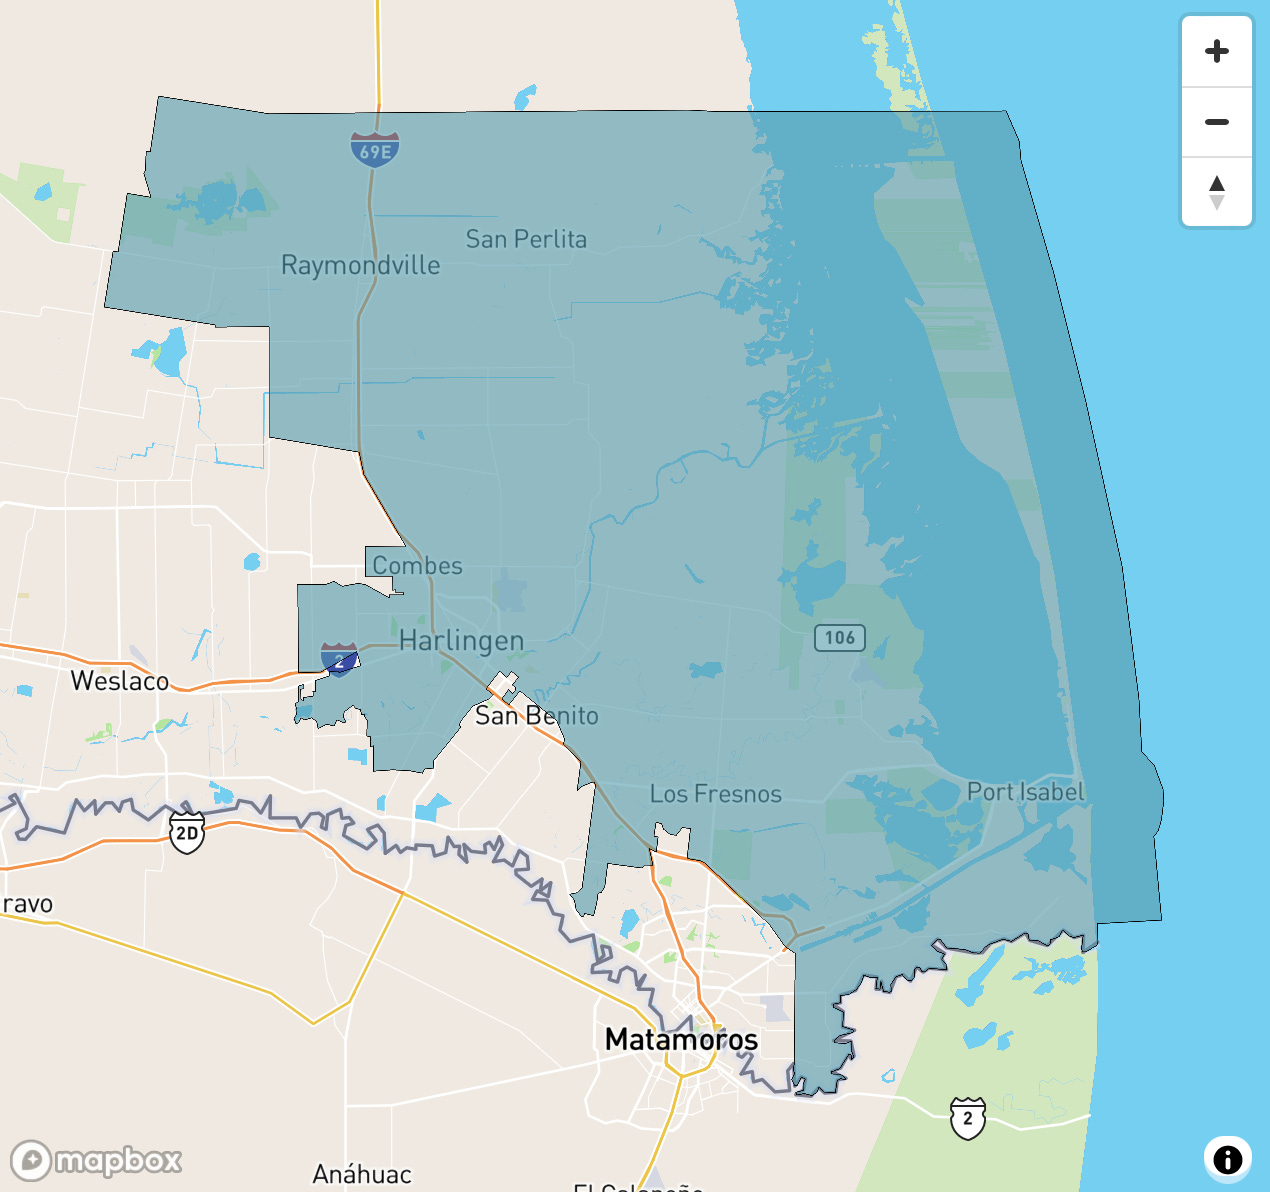
Texas House District 37
Outcomes in 2012, 2016, and 2020 with Trend for 2024
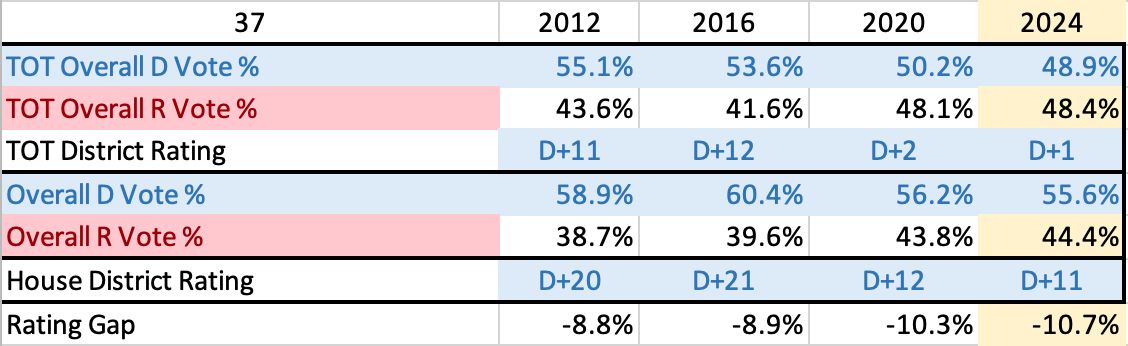
In each Presidential election, the Democratic Texas House candidate gains more votes than the President. This is a seat where there haven’t been Republican opponents for the House, so the top of ticket (Presidential) vote outcomes are exact, the House level aren’t. This seat went Republican in 2022. With expected turnout for 2024, trend says it would go back blue.
2024 Race for Texas House District 37 is Janie Lopez (Republican Incumbent) vs Jonathan Gracia (Democrat)
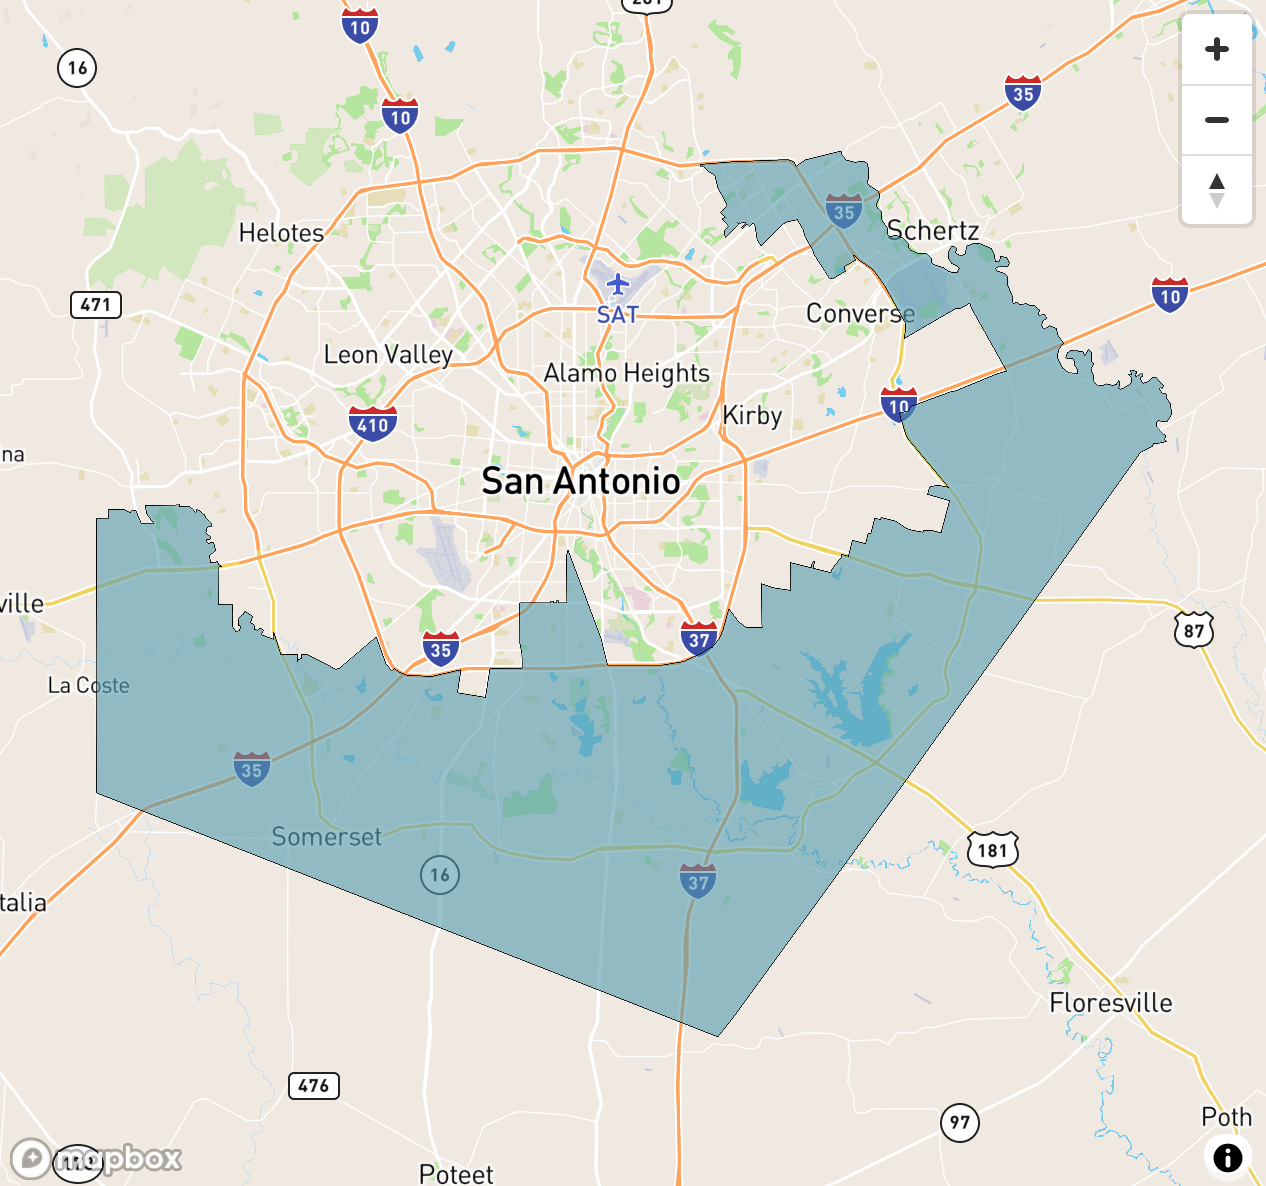
Texas House District 118
Outcomes in 2012, 2016, and 2020 with Trend for 2024
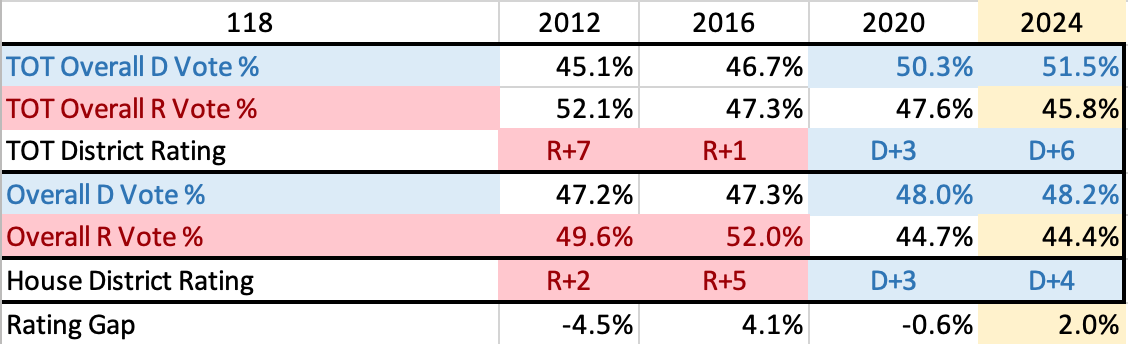
For Texas House District 118, the one year where the people in its precincts favored the House member vs the top of ticket was 2016, with a 10 point rating gap. Otherwise, this one sticks pretty close. Trend is pretty clear: Red, less red, blue, and for 2024, slightly more blue.
2024 Race for Texas House District 118 is John Lujan (Republican Incumbent) vs Kristian Carranza (Democrat)
Those are the two races the trends say see both the top of ticket and Texas House race flip blue.
That’s plenty of words for today, and hopefully a few things for you to consider. I’ll be back shortly with more groups of races that should garner attention as the rational look to keep Texas from going fully into the deep end.
See It. Name It. Fight It.
**NOTE: The original version of this post included a 3rd district that trends put in Group 1. With over 9,000 rows and numerous columns of data, two races had their results in twice, which impacted multiple precincts. With those errors fixed (and the rest of the document scrubbed to ensure accuracy), HD112 moved into Group 2 and my next post.**
What is the significance, if any, that these targeted races all have apparently Hispanic candidates?